This article describes how to create a Pivot Table based on the data you have collected in ActivityInfo.
Pivot tables are the primary reporting tool in ActivityInfo.
You can select fields from your Forms and Subforms or use other Reports, add Measures and Dimensions and use Statistics to analyze them. Finally, you can save the Pivot table as a personal report or save it as part of a Database.
The Pivot Tables you design are visible only to you unless you add them to a Database, share or publish them.
Designing a Pivot table
To create a Pivot Table you first need to add a Measure. A measure is a value that a function works on. With a Measure you define the types of values analyzed in Pivot tables. Measures are the actual data source for Pivot Tables.
Follow these steps to create a report in the form of a Pivot table:
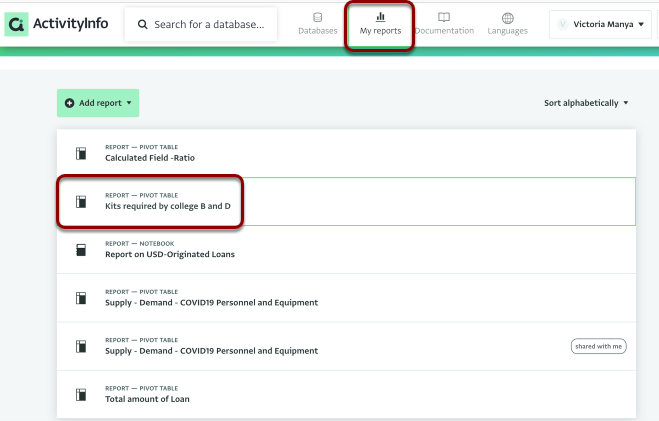
- Navigate to “My reports.”
- Click “Add report” and select “Add pivot table.”
- Select the source of data you want to use for the Pivot table by clicking on the Database, then the Folder and then the Form(s). Click “Done” to finalize your selection.
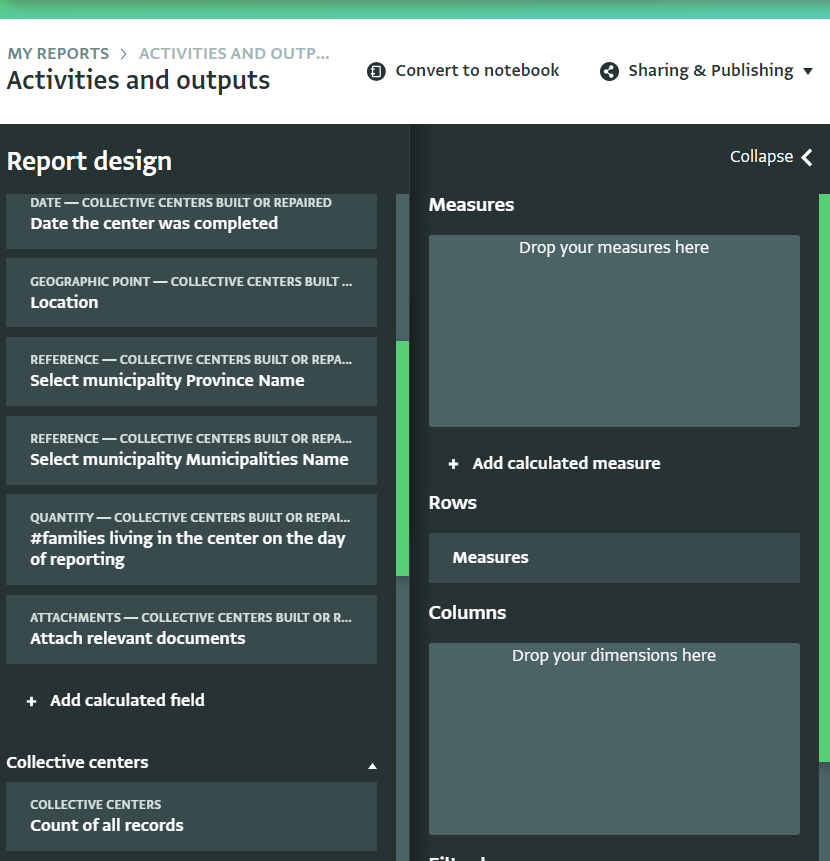
- Scroll through the list of available fields, and select the Field(s) you want to use as a Measure.
- Drag and drop the Field to the Measures panel. From the left row of columns, select any Field, use drag & drop to put it under the “Measures” section on the right Column.
You can also add a Calculated Field or a Calculated Measure.
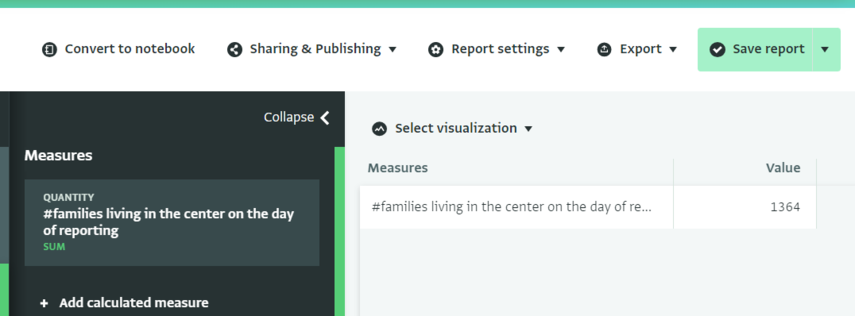
- The Measure has been added and you can view it on the Pivot Table.
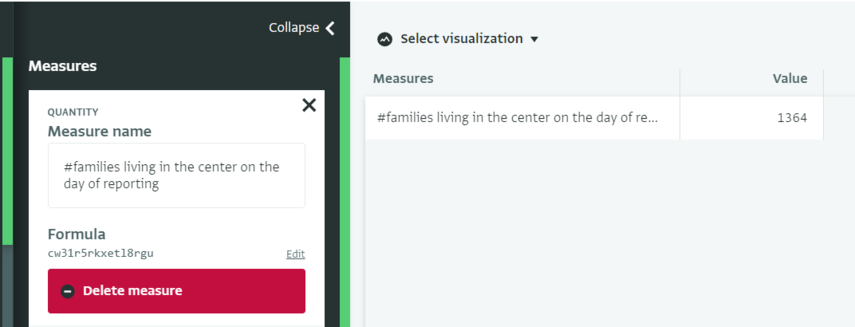
- To rename the Measure, click on the Measure and type a new name.
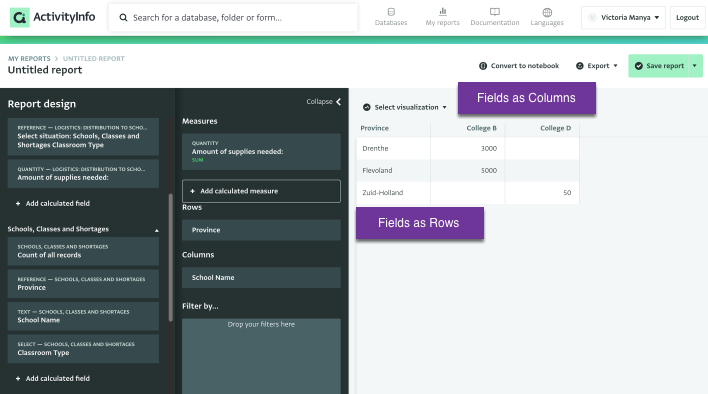
- If needed, further specify the Pivot table by adding Rows and Columns with the drag & drop method. For more information, see Adding a Field as a Row or Column to a Pivot Table.
- Consider adding filters to the Pivot table.
- Choose a display option from the following possibilities: Pivot table - bar chart - line chart - pie chart.
This example uses the “Show as pie chart” option.
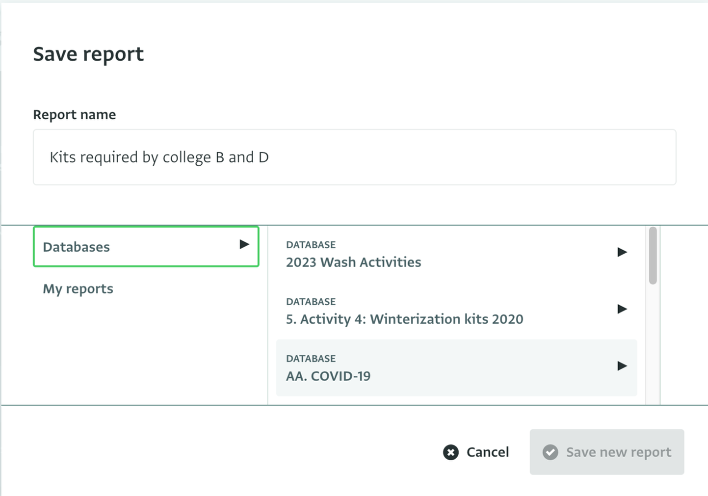
- Click “Save report” in the upper right corner.
- Name your report and select where to save it. Options: find a database and publish it there (keyword being publish), or save it under my reports (aka personal report).
- To save a Report as a personal report select 'My reports' and click on 'Save report'.
- To save a Report to a Database or Folder, navigate to the Database and/or folder you want, click on it to select it and click on 'Save report'.
Your Pivot Table has been saved as Report. You can view it in the Report List page, if it's saved as a personal report in 'My reports' or in the Database page in case of public reports.