Response monitoring and multi-partner reporting coordination with ActivityInfo
ActivityInfo has been designed to be quick to deploy and easy to use in order to support the Response monitoring in challenging environments such as in emergencies and humanitarian response plans. By gathering the data reported by multiple partner organizations in one place, information management officers can have access to centralized information and produce evidence-based, comprehensive reports and BI tools to support decision making and planning across all levels of the Response.
There are several examples of organizations working on large multi-partner programmes which reduced the complexity of reporting and partner coordination using ActivityInfo. Some examples which you can read about to take some inspiration include UNOCHA in Iraq, UNICEF in the Democratic Republic of the Congo, the IMWG in Lebanon, UNHCR in Jordan, UNHCR in Yemen, UNHCR in Turkey and UNHCR in the East, Horn of Africa and the Great Lakes region.
With this article, we explore ways in which you can leverage ActivityInfo and its features and improve collaboration and coordination in various cases such as 4W activities, RRMPs and emergencies across multiple clusters or sectors.
Focus on a single source of quality truth and create value for everyone
By using ActivityInfo to collect information from all partner organizations you can ensure that all key information can be found in one common location and manage access to it respectively. You can have both a high level overview of the response as a whole and you can drill down to the work of a specific partner, at any time.
Having a single source of truth makes coordination faster. When all partners report to a common database the time needed to synthesize reports out of the reported data is significantly decreased. This is because data is more harmonized as you can define exactly what needs to be collected and by whom in every form. Data validation becomes easier as you can add predefined validation rules in your forms to better control what partners can add as answers. Also, there is no more need for exchanging files which might result in fragmented or duplicate data.

At the same time, with reporting tools available to anyone using the platform, every partner can create their own reports and map their data in order to get a better understanding of their achievements and showcase their work. This creates additional value for the partner organizations and can also assist their internal information management processes.
Everyone gets started fast with no need for complex installations, configurations or updates
ActivityInfo is web-based and that means that there is no need for users to install or maintain anything. Also, we release software updates weekly and deliver them automatically to all users. Reporting partners can simply accept an invitation to one or more forms and start adding their data after logging into the system.
As for designing the actual data collection forms, once you decide on what kind of indicators and data you want to collect, the actual form design can start in minutes. Changes to the forms can be applied anytime to reflect changes in the programmes, too. We offer customizable database templates and plenty of supportive material to help you get started with designing forms, inviting partner organizations and their users and assigning them roles in the various databases.
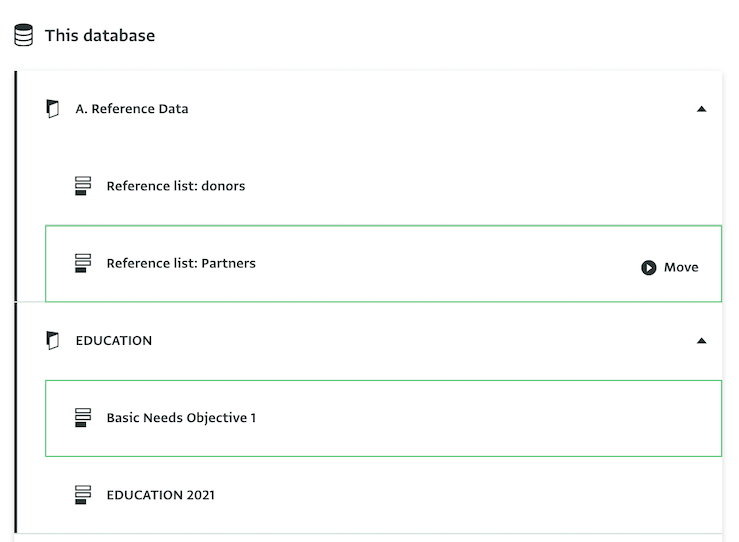
If you have forms and questionnaires with indicators available outside ActivityInfo you can import the forms and the indicators too. You can also create reference lists such as lists of donors, facilities, programme names etc. and link your forms to these lists so that users can select an answer from these lists instead of typing the answer. This ensures consistency in the answers.

Map relationships and hierarchies between organizations and their users
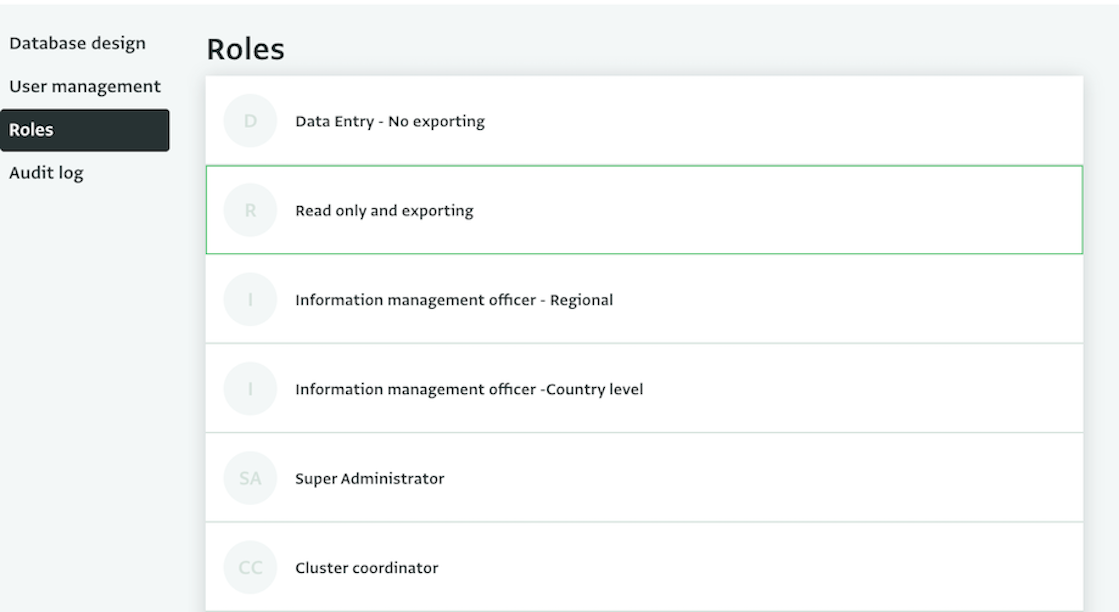
You can use the available user roles or create your own user roles with various combinations or permissions and assign them to the users invited to a database. This way you can always control what users can do in the platform and with the data collected in it. You can also give access to users only to specific forms or folders according to their position and your programme.

Additionally, using the template database for multi-partner reporting you can create groups of users under a specific supervisor, sector lead or cluster coordinator for example. Take a look at a Tutorial to create a Database for multi-partner reporting in less than 7 minutes.
Controlled simplified data collection for any reporting frequency
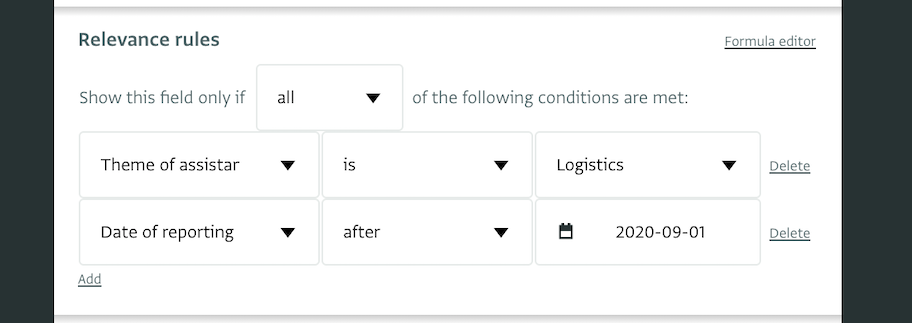
You can simplify data collection for the reporting partners in many ways. First of all, you can invite users in one of the languages supported in ActivityInfo to make the whole process easier for them. Also, users can collect data offline, if they work in remote locations with limited or unavailable internet connectivity. Then, you can add relevance rules in the forms and show to users just the fields that are related to them and thus create shorter and simpler data entry structures.

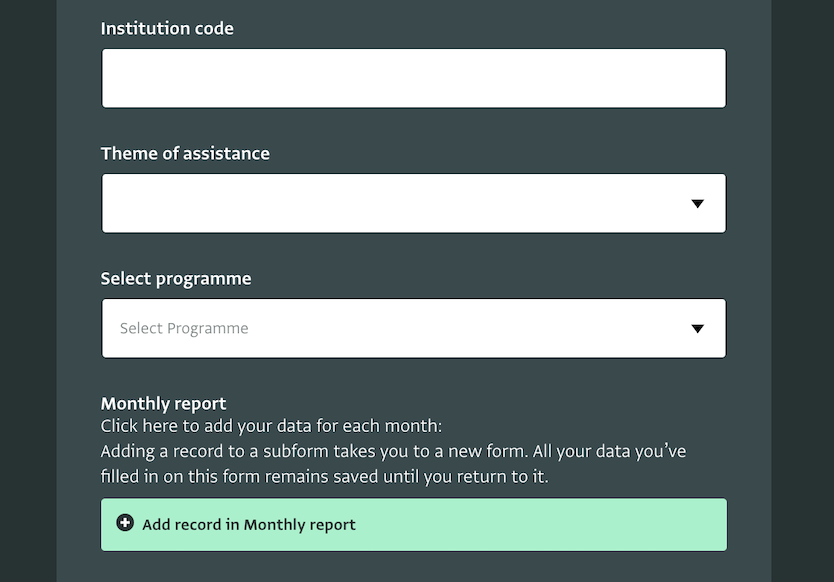
Finally, you can reduce the time needed for reporting by creating subforms within forms. For example, the form can be filled in just once to collect data that doesn't change with time and the subform can use a Month field in combination with other fields to collect data that change every month.

When a reporting period ends, you can lock a database or form to make sure that reporting partners won’t add new data or edit the data for that period. This way you ensure data remains untampered and you can create an internal process for accepting edits which will give you a complete overview of every change. Another way to control users’ actions is by using the Record History panel and the Audit Log.

Dynamic business intelligence tools to support planning and decision making
With data coming in from multiple partners you will soon have abundant information gathered in a single place which you can leverage to make sense of trends, gaps, emerging needs, duplication of effort and many more issues related to the Response.
You can analyze data and create various reports in ActivityInfo and publish them to make the progress of the activities available to the public. Alternatively, using the ActivityInfo RESTful API you can query the data gathered and create dynamic dashboards and advanced visualizations using visualization tools such as Power BI and Tableau. Take a look at the 2020 Iraq Humanitarian Dashboard created by UNOCHA in Iraq for a step-by-step process. Using such tools you can raise awareness about the Response as well as the Partners’ Presence too. Watch this video to learn how to integrate ActivityInfo with Power BI in less than 3 minutes.
Next steps: Deploying ActivityInfo in 4 steps
All in all, you can start deploying ActivityInfo quickly no matter how large the reach of the Response programme is. The essential steps to get started are:
1. Build consensus among stakeholders
Make sure that everyone involved in the process is onboard and agrees on using a common information management system. Sharing the key advantages of using such a system can be very helpful during this phase. When drafting a grant agreement include reporting requirements in it.
2. Set up forms and permissions
Discuss and agree with the relevant stakeholders on the indicators and data that needs to be collected. Map all the actors that will take part in the programme and their roles. From the people who need to have a read only access to an overview of the data to the field officers who will add the records, make sure to include everyone in this phase along with their detailed role. Then, start designing the forms and inviting users taking into consideration the points discussed in this article.
3. Launch with partners
Help the invited partners with data entry, by offering support and training on the data collection processes. Take some ideas for training materials you can create for your users and from the interactive guidance notes created by the IMWG and UNHCR in Turkey. Explain the way ActivityInfo can be used by partner organizations to create their own reports and maps or share report templates with them.
4. Analyze and publish
Start analyzing the results that come in from the data collection process and set up and publish ActivityInfo reports or dynamic dashboards integrating with other visualization tools to reach a wider public.
Want to discuss your multi-partner programme with us? Don’t hesitate to contact us!