Quick, easy and interactive indicators guidance for new staff and partners: the 3RP Guidance Notes by the IMWG in Turkey
In this blog post we take a look at an interactive tool designed by the Information Management Working Group in Turkey which makes partner training and the provision of indicator guidance to new agencies and staff easier and quicker.
We spoke with Mr. Levent Eksi, Associate Information Management Officer in UNHCR who explained to us why the IMWG decided to create this tool and how it has improved their work, the partners cooperation and the indicators quality.
The "Indicator Guidance Notes" for the 2019-2020 3RP Reporting Guidance in Turkey can be found on the Operational Portal: https://data2.unhcr.org/en/dataviz/77?sv=0&geo=0
The tool was created by: Mr. Levent Eksi, Associate Information Management Officer in UNHCR and Mr. Firat Olcay, Information Management Associate in UNHCR.
The Information Management Working Group in Turkey and ActivityInfo
The Information Management Working Group in Turkey is led by UNHCR and was established in 2016 to enhance the coordination and cooperation between partners in relation to refugee operations and sometimes non-refugee response under the various humanitarian sectors in the country.
The IMWG started using ActivityInfo as a tool for monitoring activities related to the 'Regional Resilience and Refugee Plan' (3RP) for all humanitarian sectors in the beginning of 2017, following a testing year in the Health and Protection Sector. Soon it also included non-3RP partners who contributed to the work on 3RP agencies.
The software was adopted as a means to reinforce coherence in reporting. As different sectors have different requirements for reporting and the levels of reporting varied from activities to output indicators, ActivityInfo assisted in the coordination of these.
The challenge: constant need for training on indicators
In Turkey, there are some agencies which are part of the 3RP and there are other humanitarian actors which are not part of the Response Plan but attend some of the regular meetings and aim to contribute to the Response. Since the latter don't attend all the meetings, they often miss key information and clarifications regarding the indicators that need to be collected. Additionally, the turn-over both of staff and agencies is very big in the country. As a consequence, there is a continuous need for training people and partners.
Mr. Levent Eksi, Associate Information Management Officer in UNHCR, explains:
“It became a huge problem for us; to organize continuous training sessions every month trying to find and include everyone and then train them on what the indicators are.”
Early solution: Guidance Notes as a document
To address these challenges, the IMWG created one PDF document for each sector which included all the guidance notes related to the indicators. The objective was to explain what each indicator means, the terminology, the targets, the source of data, the validation methodology, the denominator and other useful information. This proved to be a nice solution for the challenge of keeping partners updated and informing new agencies and staff about the indicators quickly.
However the static nature of the file soon started to cause inconvenience since whenever there was an update in the guidance, it had to be reflected in the PDF. This made it difficult for partners to follow the changes, track the latest version and keep up. Also since every sector followed a different structure, there was the need to maintain different formats which was time consuming too.
Updated solution: The interactive tool
So in January 2019, the IMWG in Turkey decided to turn the PDF report into an interactive tool. As a result, the Guidance Notes tool was created and hosted in the inter-agency data portal in Turkey.
The tool does exactly the same thing as the PDF document; it provides information about the indicators and it has been enriched with more information. Unlike the PDF document, the interactive tool is easier to find and it is always available only at its latest version. So partners can use it to better understand the indicators, clarify things and train their own staff based on a common, updated guide.
“We created this interactive dashboard and posted it on the inter-agency data portal in Turkey. So instead of sharing the latest version of the PDF for each sector, we just share the link and people are using it to clarify certain things, or train their own staff. So it was mostly a solution for the turn-over of the staff and a way to fulfil the needs of the new agencies as well” explains Mr. Eksi.
This tool had a positive impact on the partner trainings as well. Instead of repeating long trainings to new staff and agencies on what each indicator is, the IMWG now gives shorter refresher trainings. During these trainings they simply explain what ActivityInfo is and how it is used and then they present the interactive guidance tool and how it can be used.
“Now in the trainings first we show to the partners what ActivityInfo is, how to use ActivityInfo, what it is good for, what is its use and purpose, what we are getting out of it and then we show them the Guidance Note and how to use it. This way they know how to use the reporting tool and they learn how to access the information needed for the tool. So it is very easy for us we just point them to the right direction and then they find the answer to it”, notes Mr. Eksi.
The interactive Guidance Notes were welcomed by around 50 partners and 600 individual users who use it for their reporting regularly. All agencies and their staff, regardless of the training they got in their sector, can rely on the information shared on the Guidance Notes. This helps avoid contradictions and loose interpretations of indicators and terminology and enhances the quality of data gathered.
How it works
For the indicators for 2019, the IMWG has merged the forms and activities of all sectors in Turkey in one database in ActivityInfo and this serves as the central inter-sector database for the country. The rest of the databases are used to serve short-term solutions for other types of activities and are not included in the Guidance Notes tool.
Having one database makes the whole process easier as there is only one database that needs to be updated. Although the IMWG uses the ActivityInfo API a lot to link the data collected in ActivityInfo to published dashboards, the guidance tool is not using the API since it doesn't need to be updated very frequently. Instead, they use an offline Excel spreadsheet that includes all the information regarding the indicators and their location in ActivityInfo which they link to Power BI to produce the Guidance Notes tool.
The updates on the tool are not very frequent and they usually have to do with clarifications on indicators following a question asked in a meeting or with small changes in terminology to help explain better what the indicator needs to capture.
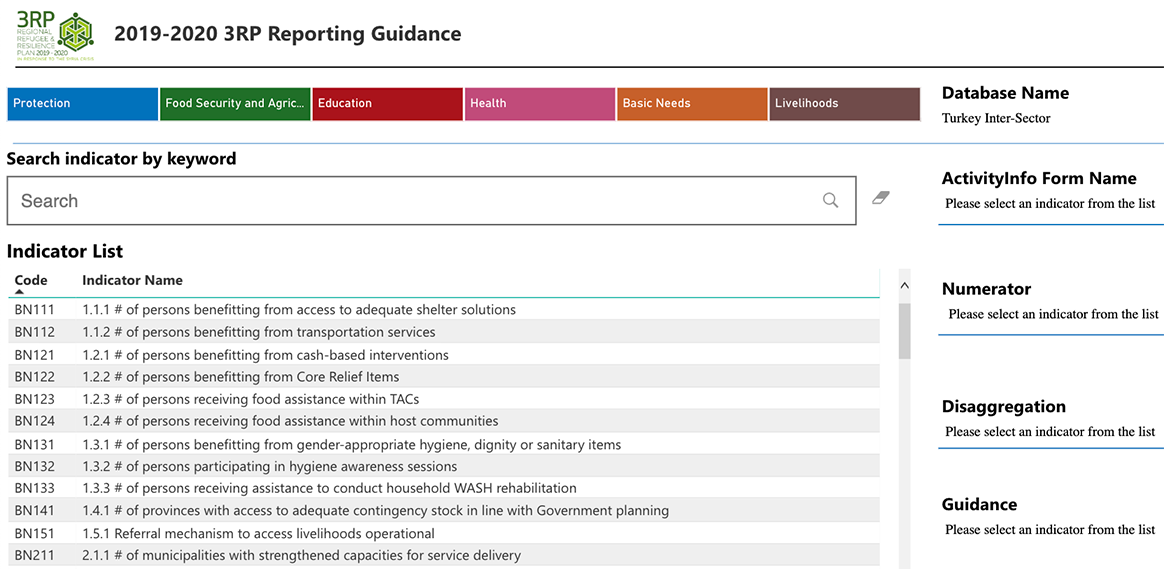
Users just need to select the sector and then the indicator from the list. They can also use the search bar.
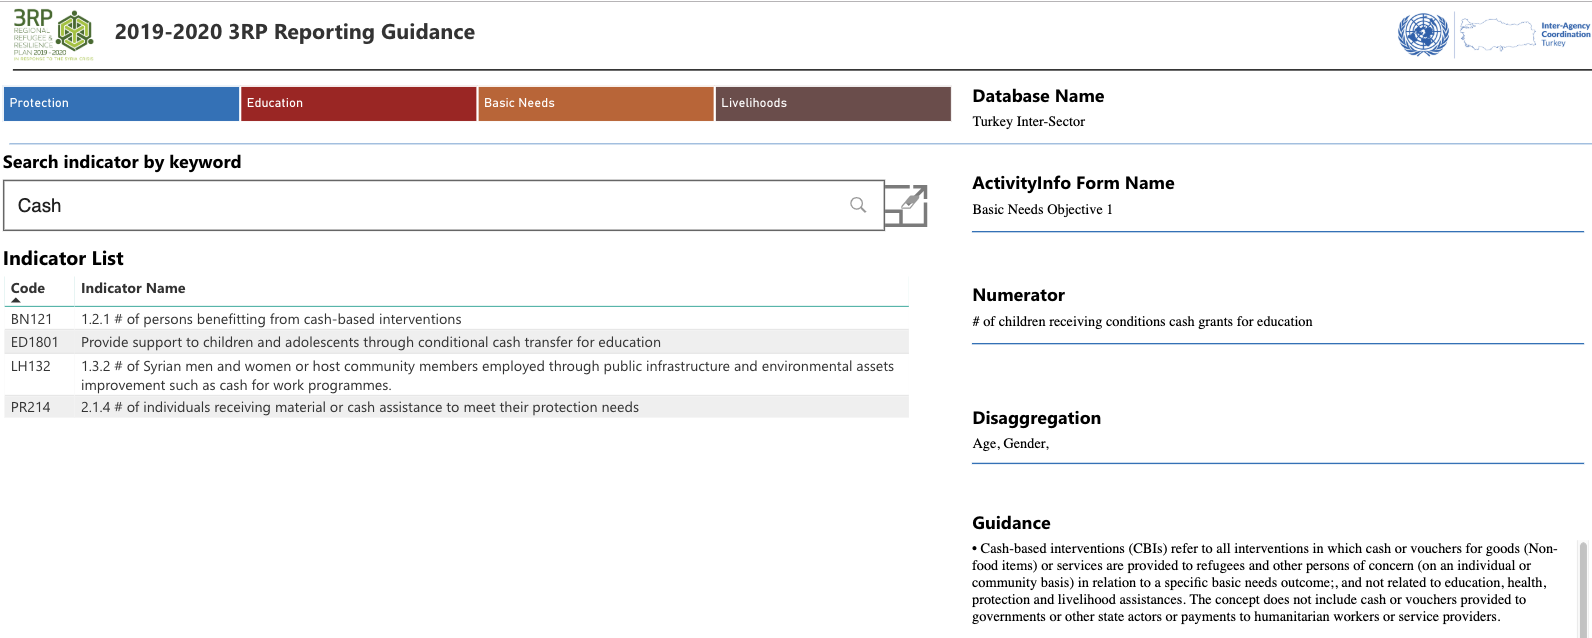
“The search bar is very helpful because then you just need to type the terminology. Let’s say you type in ‘cash’. It lists down all the cash-related indicators and then you can find the relevant indicator that you are looking for or you can filter by partner or filter down by sector and it just shows you all the indicators on this sector” explains Mr. Eksi.
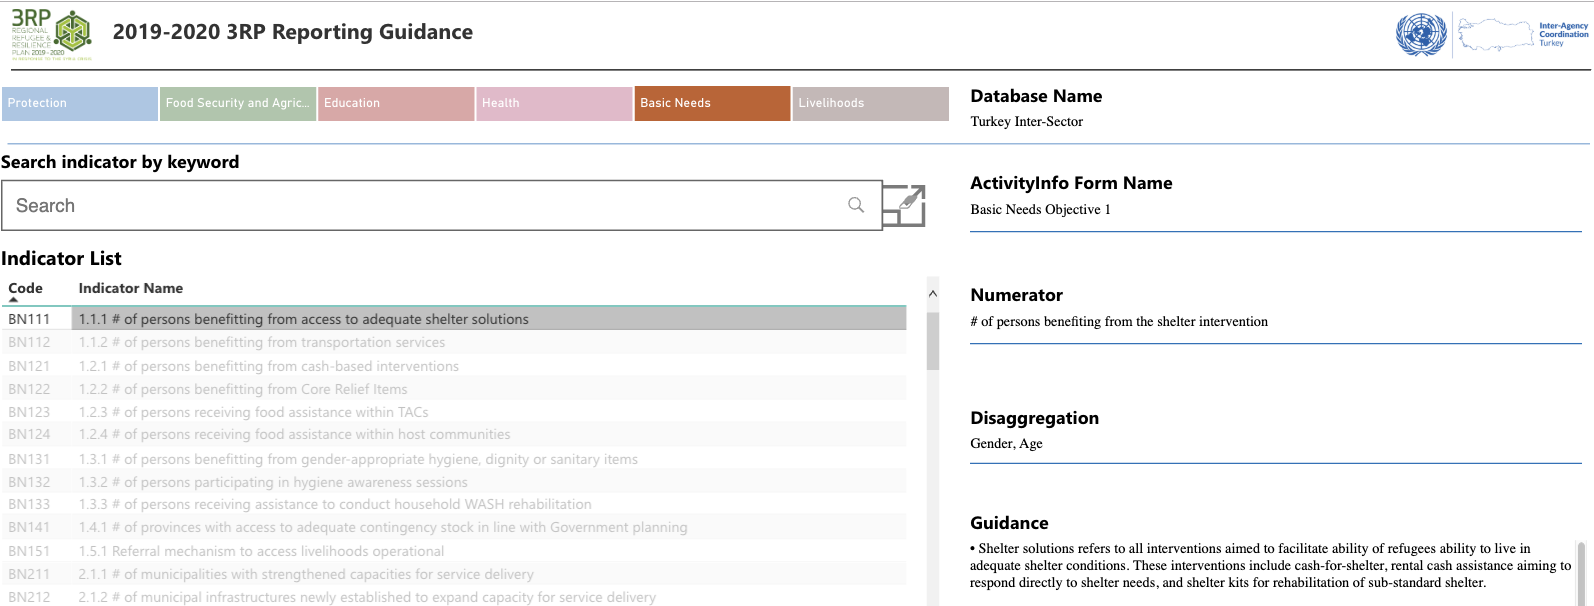
Once the indicator is selected, users can see all the information related to it at the right side of the dashboard. Information includes the name of the ActivityInfo Form where the indicator appears, making it easier for users to track the indicator in the system. Also users can find the numerator and the disaggregation method as well as more general guidance.
Also, the Guidance Notes tool uses codes to allow Information Management officers to quickly browse indicators and definitions and help partners better understand the type of the indicator and the disaggregation needs.
We would like to warmly thank Mr. Levent Eksi for providing us with all the information for this blog post.