Multi-partner reporting with UNOCHA Iraq: from standardized forms to an innovative dynamic dashboard
Understanding the cause and effect, the trends and the overall impact of Response activities is crucial when working on a Humanitarian Response Plan, both during the planning phase and during the actual monitoring process. By having access to key numbers achieved during the previous year, new indicators can be set more precisely during the planning phase which can be better supported. At the same time, when the monitoring phase starts, all relevant stakeholders, from IMOs to cluster coordinators to partner organizations in the field can easily cooperate and coordinate their efforts based on a single source of truth.
Every year, UNOCHA in Iraq shares the Iraq Humanitarian Dashboard, a dynamic dashboard that presents an overview of the Humanitarian Response in the country. From year to year the Humanitarian Dashboard is evolving using innovative techniques, leveraging the possibilities of the ActivityInfo API. You can have a look at the remarkable Humanitarian Dashboards in 2018 and in 2019 for more details. In this article, we take a look at the new developments in the 2020 Iraq Humanitarian Dashboard.
The Dashboard brings together data from more that 150 partners and 10 Clusters who work and report on multiple HRP and non-HRP activities in Iraq. This year, following the COVID-19 developments, the dashboard brings in even more information and presents a comprehensive overview of the 2020 Humanitarian Response Plan (HRP), including activities related to COVID-19. At the same time, it offers a new, innovative approach to information management and humanitarian response reporting with an approach that brings activity-based reporting in the spotlight.
All the data presented in the dashboard is collected in ActivityInfo by partner organizations and the clusters. The ActivityInfo API is then used to bring in the data and following multiple queries, data cleaning and aggregations the data is visualized using the Power BI software. The Dashboard that results from this process is updated daily at midnight and can be found at the OCHA Humanitarian Response website.
The Dashboard is used daily by multiple stakeholders including the government, UN agencies, clusters and donors. It is also used for the daily and ad-hoc reporting by UNOCHA in Iraq and clusters validating their achievement.
We spoke with Mr. Sameer Al-Rubaye, Information Management Officer in UNOCHA Iraq, who walked us through each page of the dashboard he developed, explained the new activity-based reporting approach and discussed how ActivityInfo can be leveraged for the coordination of multi-partner reporting.
Preparation for harmonized multi-partner reporting in ActivityInfo
According to Mr. Al-Rubaye, when working with such a large number of partner organizations, it is essential to make the reporting process as easy as possible for them. Larger national or international NGOs, in particular, usually report for more than one cluster and for multiple activities. UNOCHA in Iraq simplifies the reporting process by creating standardized forms in ActivityInfo which can be easily used by all partners. This makes the training of partner organizations quicker as it eliminates the need to learn different reporting techniques or to handle different types of data collection forms.
“Simple Forms. Design them that way and you will get the data. Design them in a complex way and you will get a mess. I don't want partners who are reporting on Health activities, when they close the form ‘Health’ and go to the ‘Shelter’, ‘NFI’, ‘WASH’ or any other form, to see a different reporting form type. We standardize the forms so that it is easy for the partners. So they can report for many clusters and many activities, in the same way. This is one of the good options offered by ActivityInfo”, notes Mr. Al-Rubaye.
Combining the COVID-19 reporting with the HRP activities
As in most humanitarian response settings, the COVID-19 developments created an unprecedented information management challenge. UNOCHA and the clusters had to decide whether the COVID-19 related activities would be included in the 2020 HRP reporting activities and in the respective ActivityInfo databases. Following discussions with the cluster coordinators and IMOs, the decision to include the COVID-19 activities in the existing databases was taken.
This was the easiest way to check whether an HRP activity is related to COVID-19 and it minimized the effort required by partners during reporting. As a result, all existing ActivityInfo forms were updated and enriched to allow partners to select whether their reported data are related to COVID-19 activities or not. Once the decision was made, applying the actual changes to the ActivityInfo forms was quick and easy. Then, the dynamic dashboard was updated too to offer real-time updates both on COVID-19 and non COVID-19 activities, based on the data reported by the partners in ActivityInfo.
Synthesizing the overview of the Response (page one)
With more than 60 queries, the data gathered by each cluster in the ActivityInfo forms are combined and brought into Power BI using the ActivityInfo API with the purpose to create one finalized 4W. As there are many different types of reporting activities -including some late HRP 2019 activities - and the reporting cycles vary, many levels of aggregation are needed.
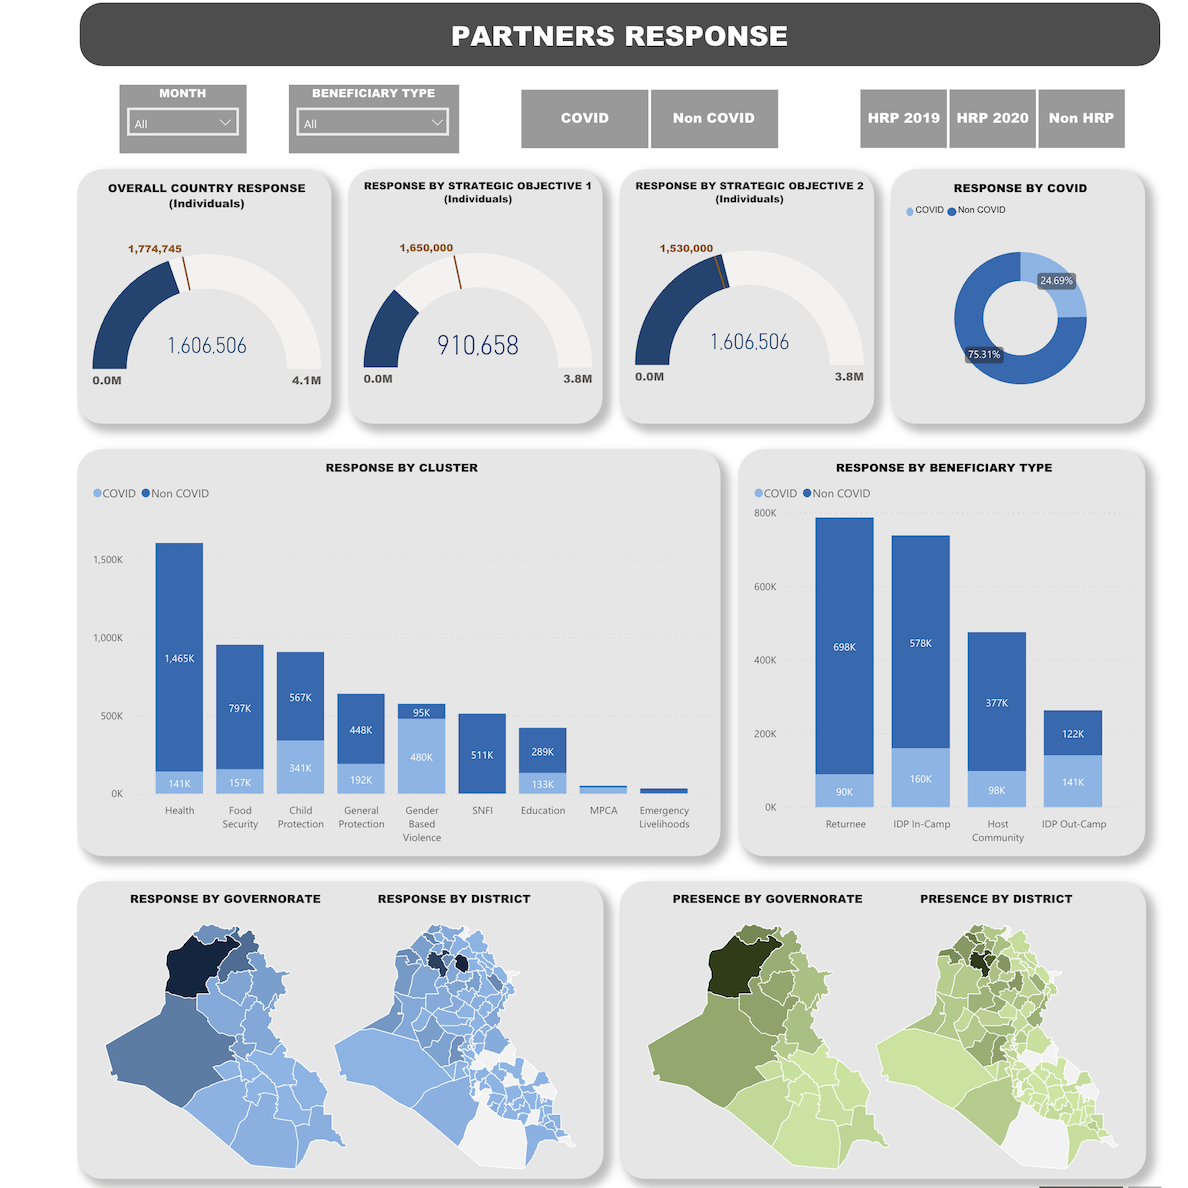
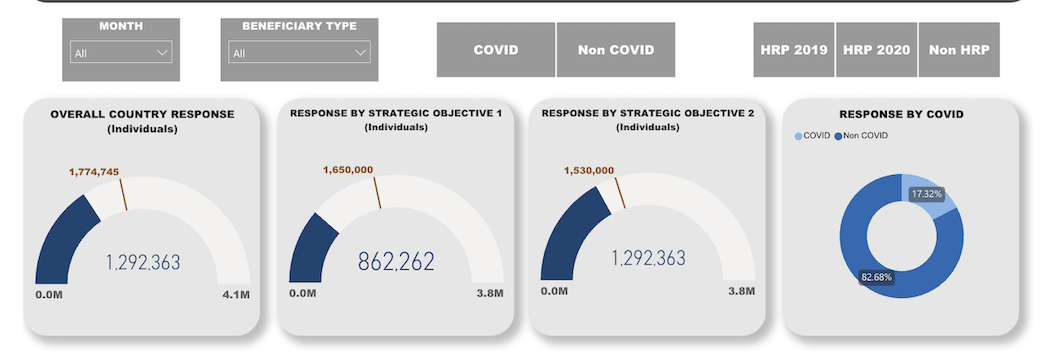
The first page of the dynamic dashboard shows the country’s Response and - being interactive - allows viewers to focus on a specific number just by clicking on it. In more detail, the dashboard presents the overall Response, the Response by Strategic Objective and Specific Objective along with the target numbers for 2020 as well as the percentage of COVID-19 and non COVID-19 Response for these numbers. It provides a variety of filters so that the viewer can narrow down and view the Response for a specific month, beneficiary type, plan and to distinguish between COVID-19 or non-COVID-19 activities.
It also presents the Response by cluster and by beneficiary type (returnees, IDPs in and out of camp and host communities) distinguishing once more between COVID-19 and non COVID-19 activities.
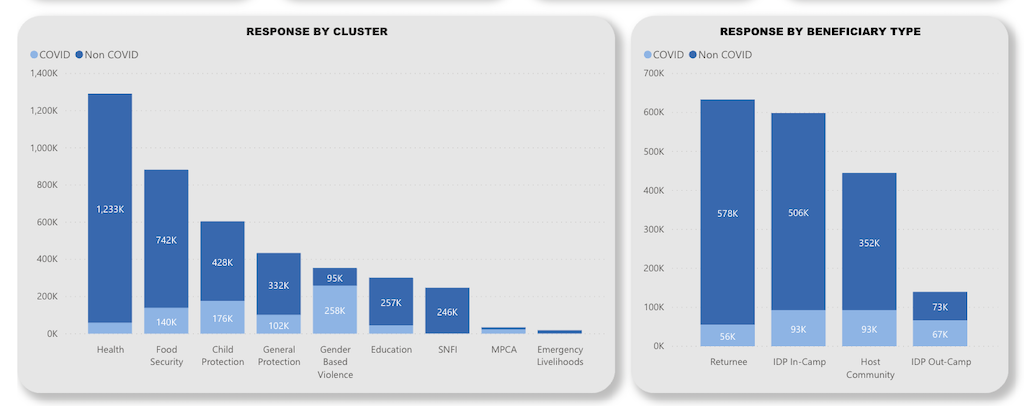
Finally, the viewer can drill down to view the Response and Partner Presence by Governorate and by District by clicking on a specific location.

Showcasing the work of all partners (page two)
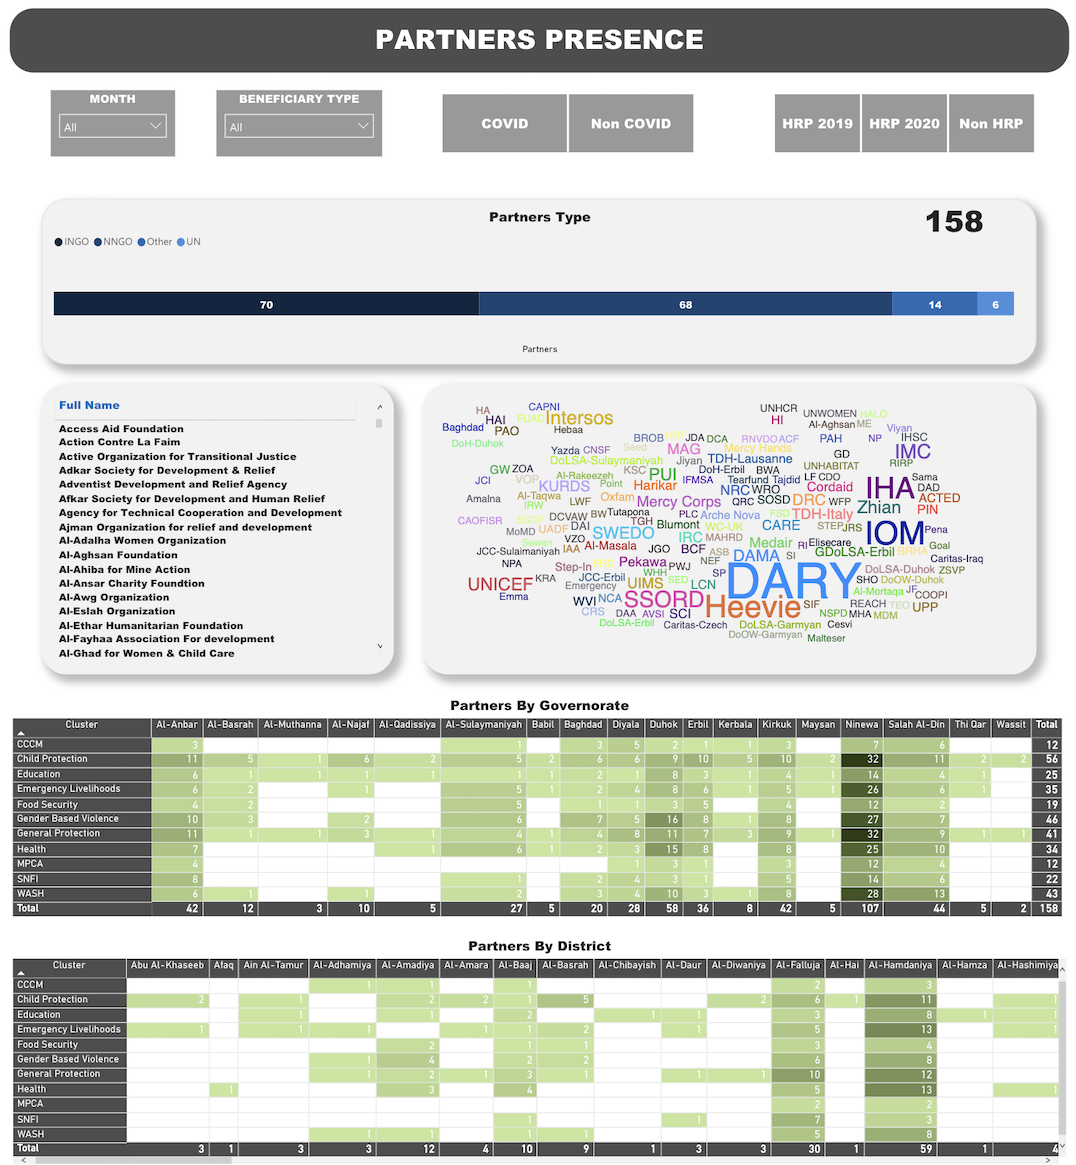
The second page of the dashboard includes more details about the partners’ presence in the country. It visualizes the partner types and their unique partners reporting by Governorate and District. The full name of all the partners is used this year and this allows viewers to recognize them or become aware about them more easily. The word cloud presents the amount of reporting done by each partner and by clicking on a partner name, the viewer can view information about the specific partner’s presence.
According to Mr. Al-Rubaye, showcasing the work of each individual partner in such detail increases the feelings of accomplishment and increases the support for using a common reporting tool among organizations.
Innovating with activity-based reporting (page three)
This year the data collected is also visualized in a brand-new way offering a more comprehensive picture of the impact of every activity in relation to the Specific (SP) and Strategic objectives (SO) of the Humanitarian Response Plan.
This new approach allows the viewer to drill down and view the beneficiaries reached at every stage of the response. So by following a top-down perspective viewers can move from the general response type to COVID-19 or non-COVID19 response to the strategic objective and then to the specific objective, to the cluster type and finally to the specific activity code.
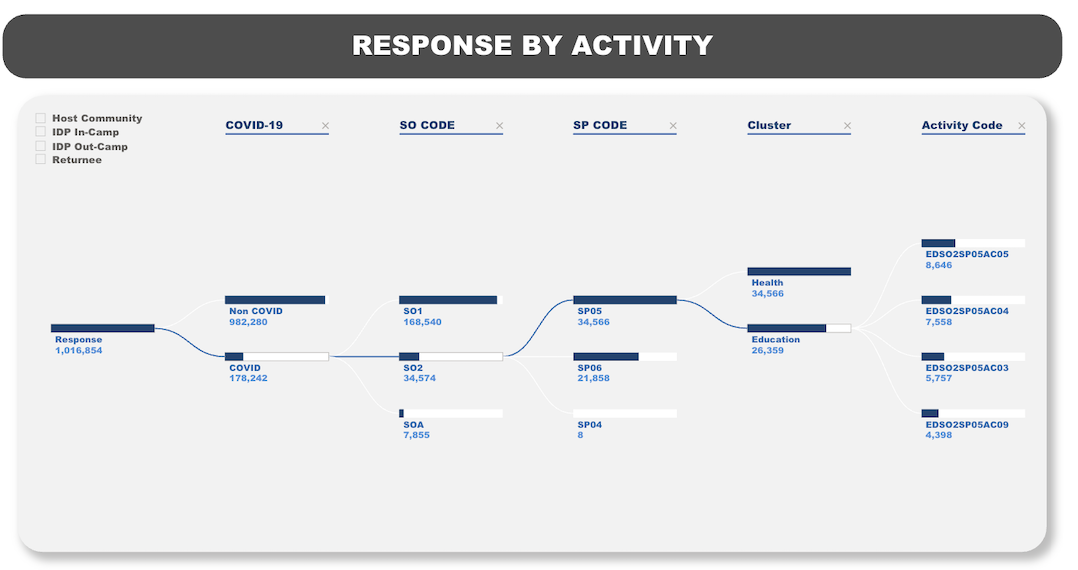
By clicking on an activity code viewers can easily get more details about the activity and its relation to the SP and SO.
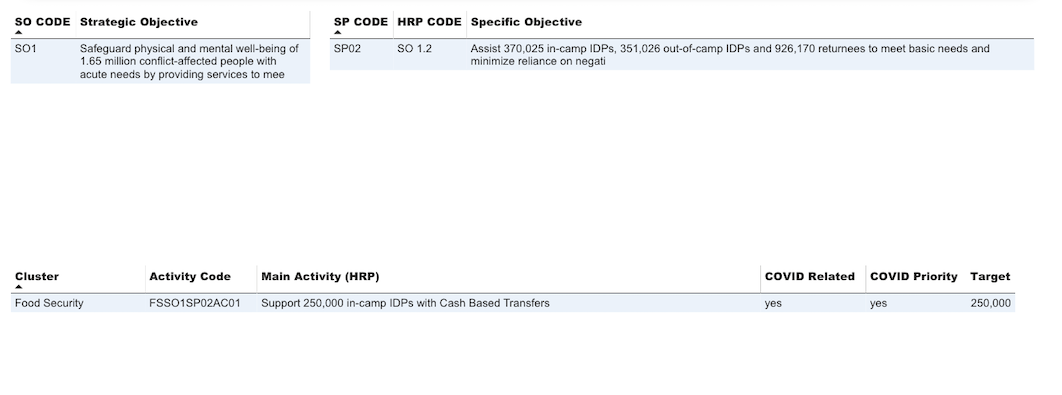
“This is a more advanced approach and I think it is the first time and that we are the first office to present activity-based reporting. We are becoming more advanced with ActivityInfo and the data collection processes. Previously, we were taking and aggregating the numbers and the people reached at a higher level by geography, by clusters. Now, we do more in-depth analysis, based on the activities”, explains Mr. Al-Rubaye.
Using ActivityInfo for multi-partner reporting
ActivityInfo was developed as a solution to the increasing demand for coordinating partners reporting during the Democratic Republic of the Congo Emergency around the period 2009-2013. Since then, it has been adopted by multiple organizations working in multi-partner programmes who seek for a solution which is easy to set up and customized to the particular needs of partner level reporting. With advanced permissions and a database template with user roles specifically designed for collaborative reporting, it allows organizations such as UNOCHA in Iraq to coordinate the reporting efforts of more than 150 partner organizations of various sizes under 10 individual clusters.
“The most important thing for us as in OCHA Iraq is that ActivityInfo is suitable for partner-based reporting. If you look at other tools, they are all for high-level reporting. They start from the cluster that is reporting. The cluster needs to collect data from the partners, then compile it and then put it in the system. In ActivityInfo it starts from the partner. So that is why we insist on using ActivityInfo, because we are getting the data in real-time. With other tools, when they reach the lower level they find out that each country has a different technique. So they cannot standardize the reporting for the offices worldwide.
Then, as OCHA we are responsible for crises. When there is a crisis in any country, people come from different perspectives and from different technical levels so it’s difficult to build a new system from scratch. When there are flexible systems for activities, just like ActivityInfo, you have a form, you build your own data collection, you choose the reporting level and it’s ready to go. Imagine you went on a mission or to any crisis in the world; you don't need to think about data collections and spreadsheet issues. You have one tool ready, ActivityInfo, just design your form and it will take you an hour”, explains Mr. Al-Rubaye
Also, using standardized forms that can be quickly built and updated the organization centralizes vast amounts of information in the platform.
“The best thing about ActivityInfo is that you centralize the information. You use a one ‘stop-shop’ for data collection. As for the reporting side, related either to the clusters or the partners, it’s easy”, adds Mr. Al-Rubaye.
Finally, with the ActivityInfo API all data can be easily queried and connected to visualization software such as Power BI and Tableau.
“From my side, the technical perspective, the API is very solid and great; it didn't give me any errors. Rarely do I have some errors and then I call you. Sometimes it’s from my side or your side and it’s solved. We haven’t lost any data since 2017 which is when we started using it and up to now it all works perfectly”, concludes Mr. Al-Rubaye.
More innovation in information management in 2021
For the 2021 ActivityInfo database, UNOCHA in Iraq is planning another information management innovation. With the new approach, OCHA will be able to view activity-based costing and to understand better the cost per activity for each beneficiary. Mr. Al-Rubaye explains,
“OCHA Iraq is now expecting partners to aggregate their activities and they want to know the cost per activity for the beneficiary. So it will become easy for us to track that. In 2021, we will have a database with financial and response tracking.”
As with every year’s dashboard, we will be looking forward to it!
We would like to warmly thank Mr. Sameer Al-Rubaye, Information Management Officer in UNOCHA Iraq for his contribution in this article.
Do you want to share the way your organization leverages ActivityInfo for information management? Don't hesitate to contact us!