Information Management at its best: UNOCHA in Iraq leverages the ActivityInfo API to synthesize the Iraq 2019 Humanitarian Response Dashboard using data collected by all the Clusters.
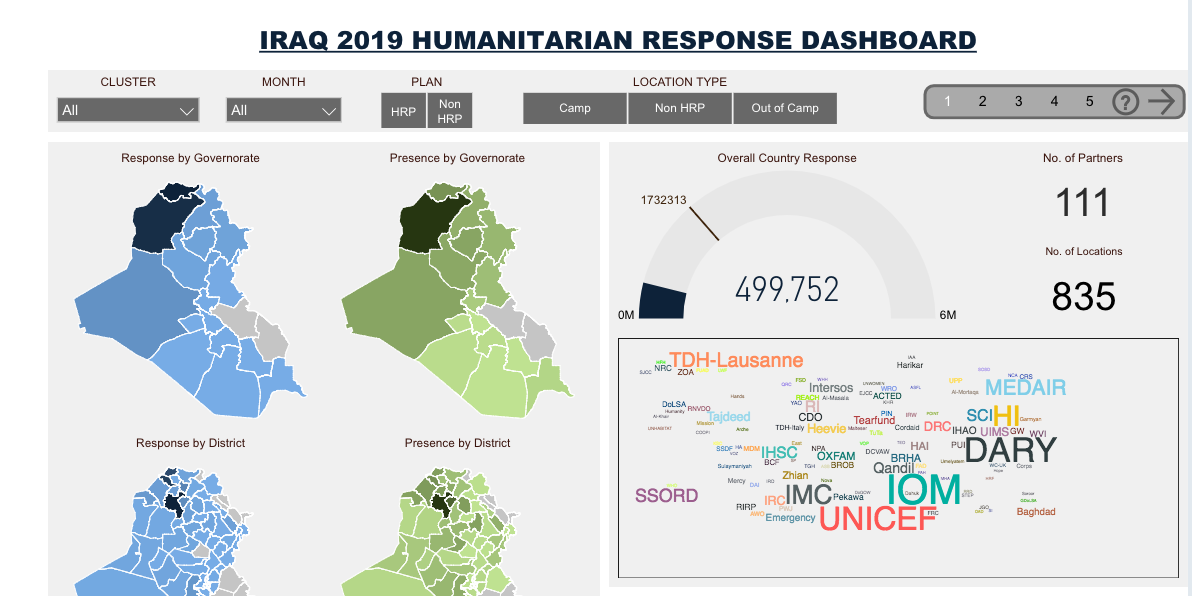
Following the remarkable 2018 Iraq HRP Monitoring Dashboard, UNOCHA in Iraq released the "2019 Humanitarian Response Dashboard" which presents a comprehensive overview of the Humanitarian Response in the country. The Dashboard presents the Humanitarian Response regarding IDPs, returnees and affected host communities, under the HRP or other Non-HRP related activities in more than 800 locations, as well as the humanitarian presence of 111 partners.
Using a variety of filters the viewer can narrow down the analysis and understand the Response and the Partner Presence for each Cluster by Governorate, District, Sub-District or Location. Also the Dashboard presents the progress of the Response in relation to the strategic objectives, the funding status and the modality of assistance.
We spoke with Mr. Sameer Al-Rubaye, Information Management Officer in UNOCHA Iraq, who walked us through the five-paged dynamic Dashboard and explained how it works behind the scenes.
Why a Dynamic Dashboard?
By combining the indicators collected and reported in ActivityInfo by the Cluster IMOs and the data collected in their Financial Tracking Service (FTS) platform, UNOCHA produces this information product that is one of the most important tools for the data analysis in their operation. The Dashboard is updated every day, at midnight and is used internally for decision making and planning. It is also available publicly for anyone in the world who wants to have a quick overview of the Humanitarian Response in Iraq and can be found on the Humanitarian Response website.
Having a quick overview of all the information at a glance allows the organization to take better decisions based on continuous reporting of centralized information.
Explaining the way in which the use of the ActivityInfo API accelerates the process of reporting and simplifies it for everyone participating in the Response, Mr. Sameer Al-Rubaye notes:
“When using ActivityInfo, Partners report directly there. So once the Partner report is there, I can get the data, clean it, automate it and publish it. In another operation, the classic way of collecting data is what they call the 3W or 4W in some operations. So there is either an Excel file, or Kobo or another way of collecting data. The Cluster contacts their partners, gets the data from the partners and then the Cluster has to do some cleaning and aggregations on the data and sent it to UNOCHA. Then UNOCHA starts to combine the data again to create their information product. So with ActivityInfo the relationship becomes directly straightforward. Partners enter the data in Activityinfo. I, as UNOCHA, have the agregational roles, the indicators, access to the ActivityInfo API, and can produce this report.”
Behind the scenes
In order to synthesize this Dashboard, the Information Management Officer in UNOCHA runs multiple queries to bring in data from various systems, such as FTS and ActivityInfo. The data is then cleaned and validated and finally visualized using the Power BI software.
64 queries are used in total, 29 of which are used with the ActivityInfo API to bring in the information collected in the ActivityInfo databases by the Cluster IMOs and their partners.
The Cluster IMOs are free to decide the way in which they will structure their databases and forms in ActivityInfo to collect the data from their partners since that is not restricting the way the Dashboard will be synthesized in the end. So some Clusters, such as the Education Cluster, create multiple forms, one for each objective and other Clusters, such as the Health Cluster, use just one form to collect indicators for many different activities or objectives.
The final synthesis is based on the indicators collected, so UNOCHA Iraq uses the ActivityInfo API to run the queries that will fetch these indicators, regardless of the form structure that the Cluster selected.
“Thanks to your powerful API, people can understand the rich situation in Iraq at any time. They just go to the website and see what is going on.” notes Mr. Al-Rubaye.
Then, using an internal Validation Dashboard created by UNOCHA in Iraq, the Cluster IMOs can quickly check if any of the indicators submitted by their partners is invalid and ask for corrections. Once a correction is made and it is reported in ActivityInfo, the Dashboard is updated to reflect this.
The Dashboard page by page
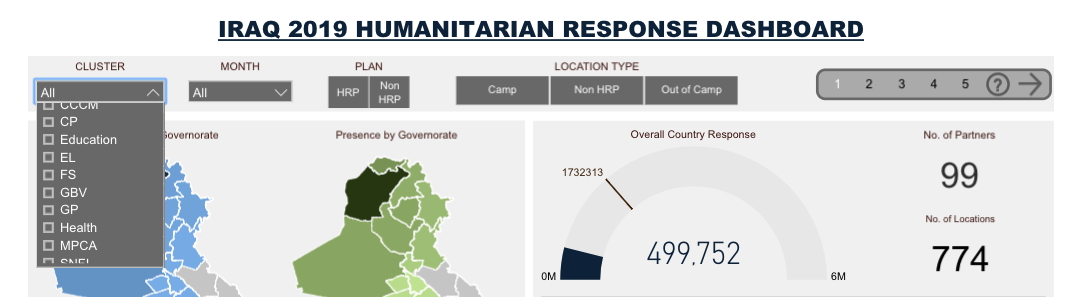
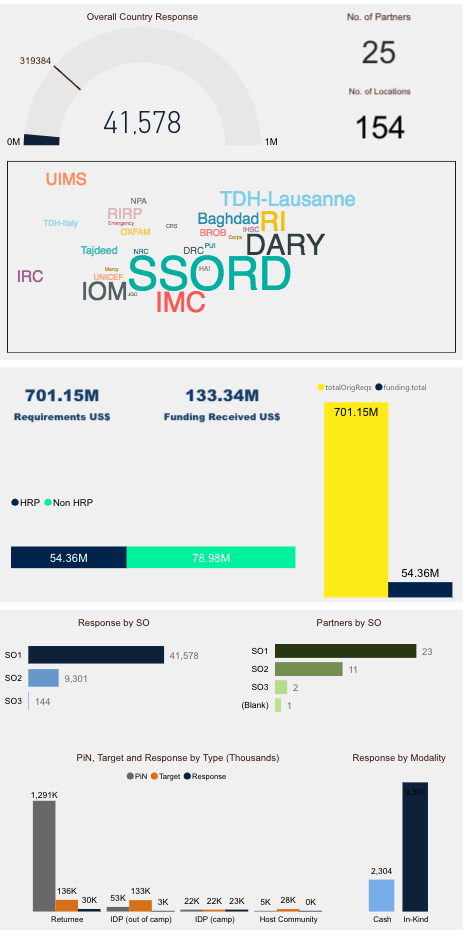
The first page of the dynamic Dashboard provides an overview of the Humanitarian Response in the country. By using the filter at the top of the page, a viewer can select to view the results for:
- Every cluster
- Every month
- Every type of plan (HRP or Non-HRP)
- Every Location Type
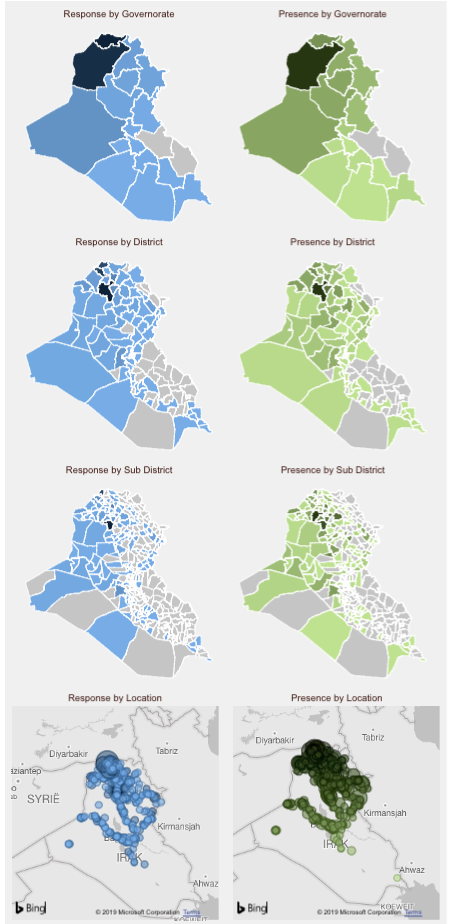
The Dashboard also provides a variety of maps to allow a better understanding regarding the Response and the Partners Presence in the country. More specifically, it presents this information for:
- Every Governorate
- Every District
- Every Sub-District
- Every Location
The Locations are based on the data tracked by the Displacement Tracking Matrix (DTM), an information management system by IOM used to understand the displacement movement. GPS technology allows the IMO in UNOCHA to get the number of affected IDPs or returnees in each Location and then add these Locations in ActivityInfo. This way when partners report for these locations, the data can be directly fetched to be used in the Dashboard.
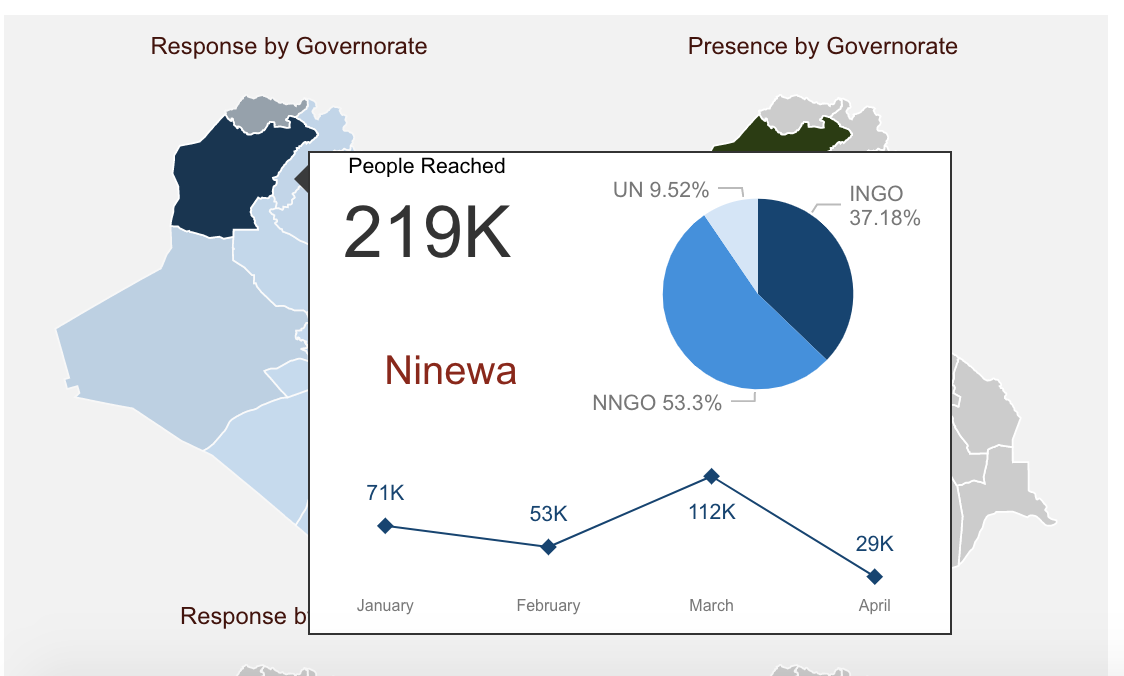
In this year's Dashboard, UNOCHA in Iraq has added a pop-up that appears when a viewer hovers over a map to provide even more information for that location. It shows the contribution of UN organizations, international and national NGOs, as well as the monthly progress of the Response or Partners Presence.
Also, the first page brings in information from the Financial Tracking System (FTS) and presents the progress towards the funding goal, the strategic objectives as well as the Response by Type and by Modality.
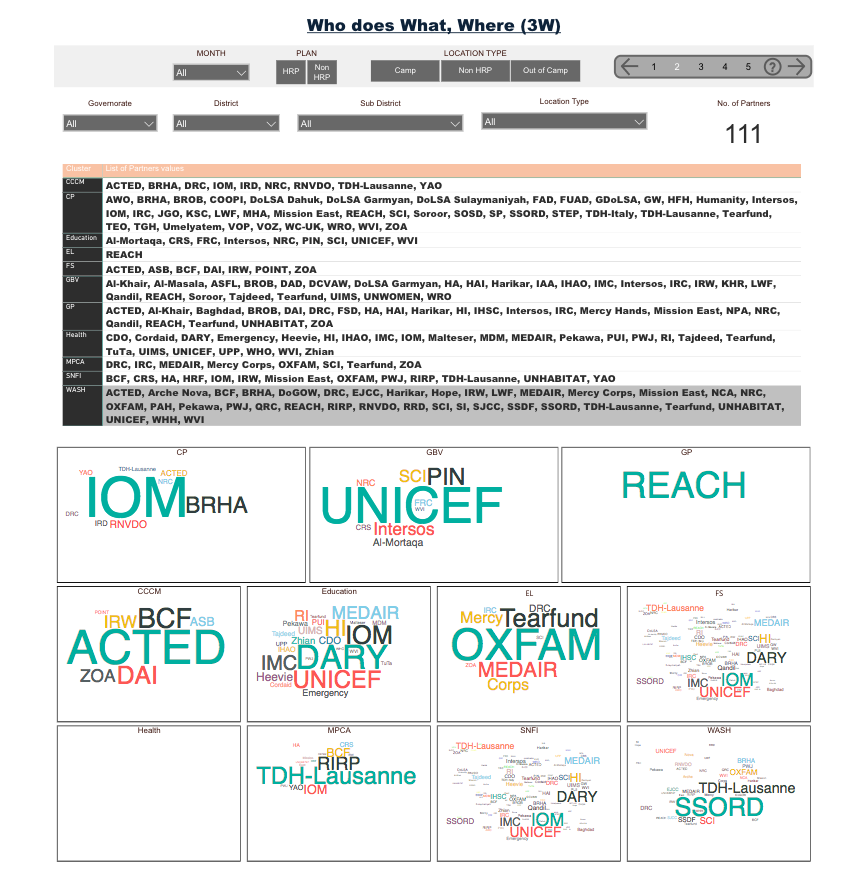
The second page of the Dashboard provides an analysis of Who does What Where (3W), as an overview for the Partners Presence. As it is based on the centralized information gathered in ActivityInfo, it is updated on a daily basis according to the partners reporting. It is aggregated by Cluster and using a word cloud it shows the value for each partner.
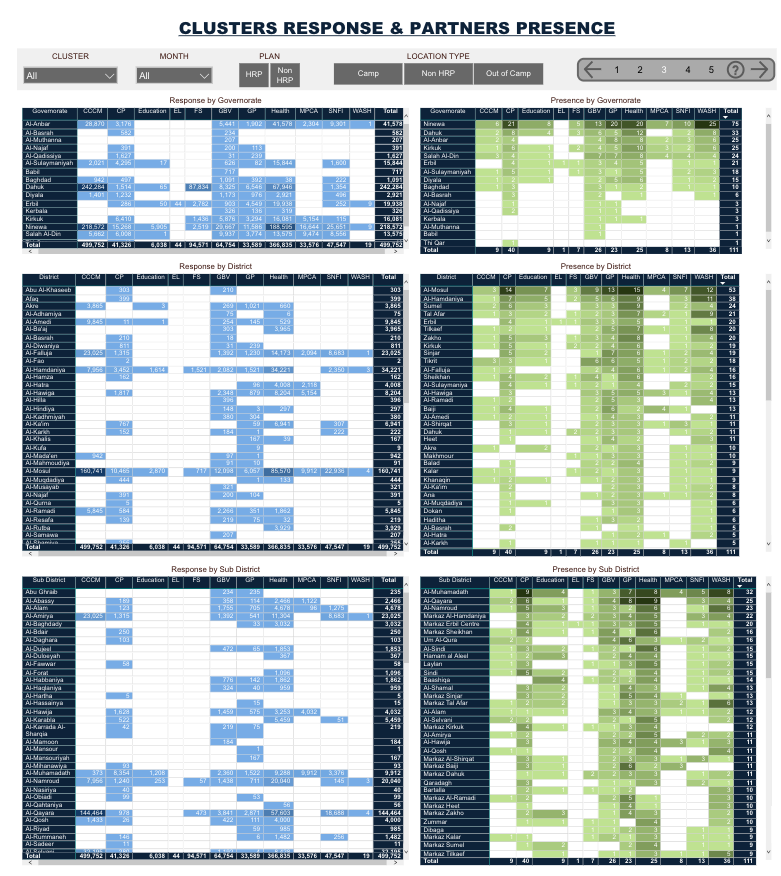
The third page is made of two-dimensional tables which show the Cluster and Governorate Response and Partner Presence in more detail, using the actual numbers. By selecting a Governorate for example, a viewer can drill down to see the details for the Districts and Sub-Districts of that Governorate.
The fourth page shows the same information as the first page of the Dashboard but focuses on the Priority Areas of 2019. The priority areas include 30 Districts in 10 Governorates in Iraq and the selection of the areas was based on the Humanitarian Needs Overview for 2019.
Finally the fifth page brings in more information from the Financial Tracking System to provide an overview of the Funding Status of the Response.
ActivityInfo and Information Management
In ActivityInfo we want to empower every user to make the most out of the data collected and enable them to give back to their organization and programme the best results regardless of the amount of the information collected or the size of the programme in terms of objectives, activities and partners.
We are excited when we see the ways in which ActivityInfo can contribute to the complex work of Information Management Officers and assist them in the creation of meaningful information products that go beyond simple visualizations no matter the size of the programme they are working on.
Are you using the ActivityInfo API to synthesize your reports? We have some articles that can walk you through the API and we are always available to provide you with extra help, just contact us!