Trainings monitoring database template
This template can be used to manage data related to training sessions. The database includes two reference forms where you can add the Trainings and the Training Institutions where trainings are conducted. It also contains three data collection forms; one for measuring the beneficiary outreach and collecting the participants list, one for a post training evaluation survey and one for creating an inventory of all the qualitative material related to the training.
After you copy this template, you can customize the database, forms and fields as well as add records to meet your needs. Click on the button below to add the database to your ActivityInfo account. If you don’t have an account with ActivityInfo, you will be prompted to start a Free trial.
Create your own database based on this template
If you need support for a different setup you can always contact us and we can help you with a more tailored approach.
Customize the reference data
The Reference folder includes forms and data to which other forms can refer. We have already included some data so you can practice.
Please note that because these forms are used in the ‘Post training evaluation survey’ (which is a form that can be shared publicly and with non-ActivityInfo users) they are marked as ‘Public forms’. This means that users in and outside the Database can view these forms and all of their records and the forms can be queried using the API without the need to authenticate. You can edit the visibility of these forms but then you won’t be able to use them in the ‘Post training evaluation survey’.
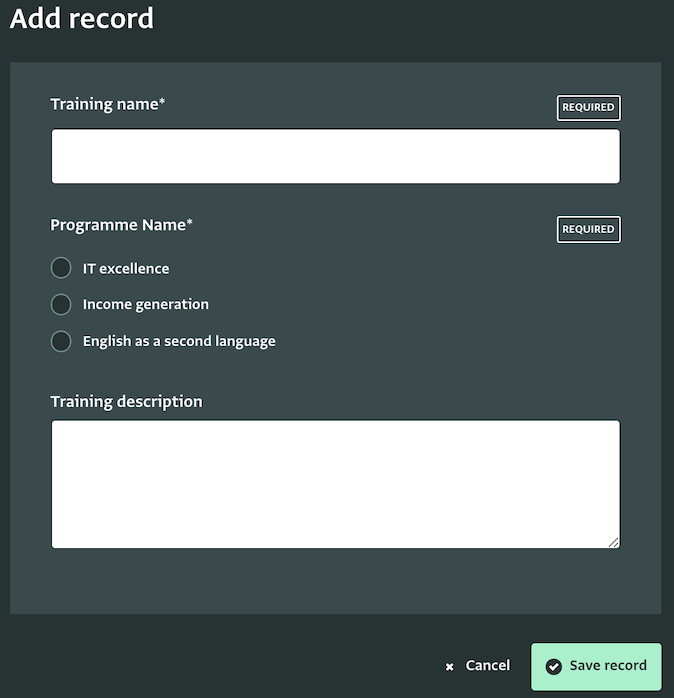
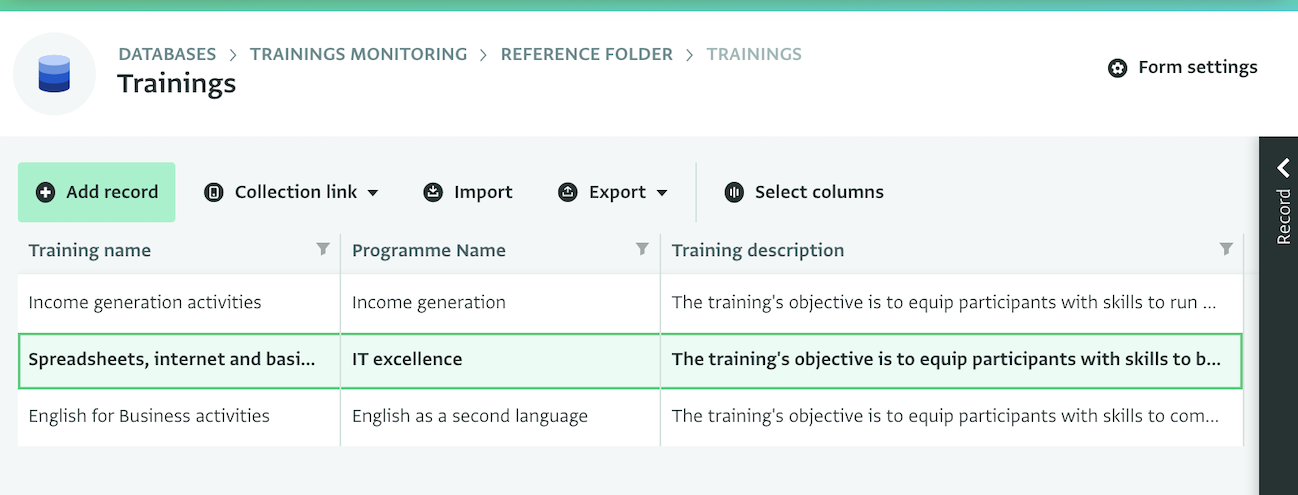
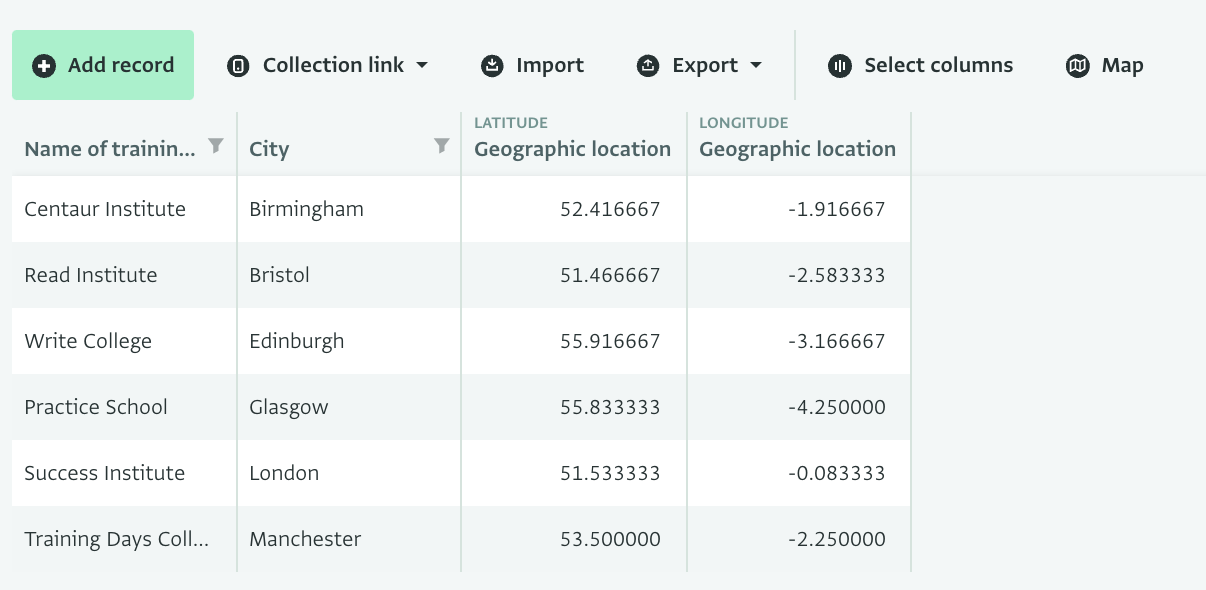
You can delete all records from these forms and add your own instead. To do that navigate to the contents of the Reference folder and in the Table View of each form and delete all records (Shift+Click). Then, add your trainings in the “Trainings” form and the training institutions in the ‘Training institutions’ form.
You can also import this data to the lists.
Invite colleagues
Click on "Database settings" and then navigate to "User management." From here, you can invite others to access the database with different roles. You can click "Add user" to invite a team member to access the database. Select the Role you want this colleague to have and the forms you want them to be able to access with this Role.
This template is configured with three roles:
- Administrator: can make any change to the database, including customizing the forms
- Trainer: can view, add, edit, delete and export all records
- Donor: can only view all records
Work with the beneficiary outreach form
You can use this form to monitor the outreach of each training. This form consists of a Parent form and a Subform. The Parent form collects the main information about the training and links to the reference forms. The Subform collects information about each participant of each training along with their gender and refugee status to help us disaggregate this data further to get the total of beneficiaries reached by gender, refugee status, location and other dimensions.
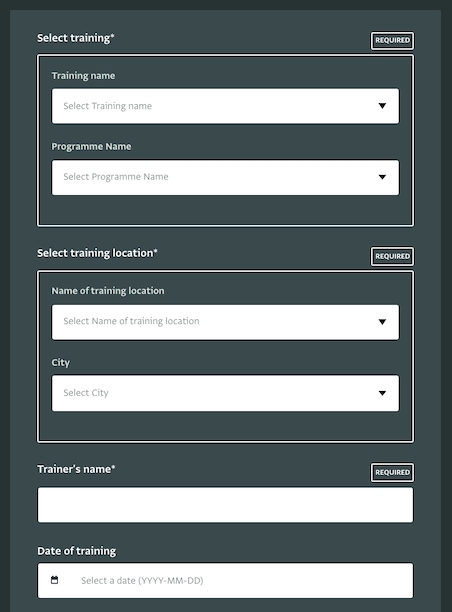
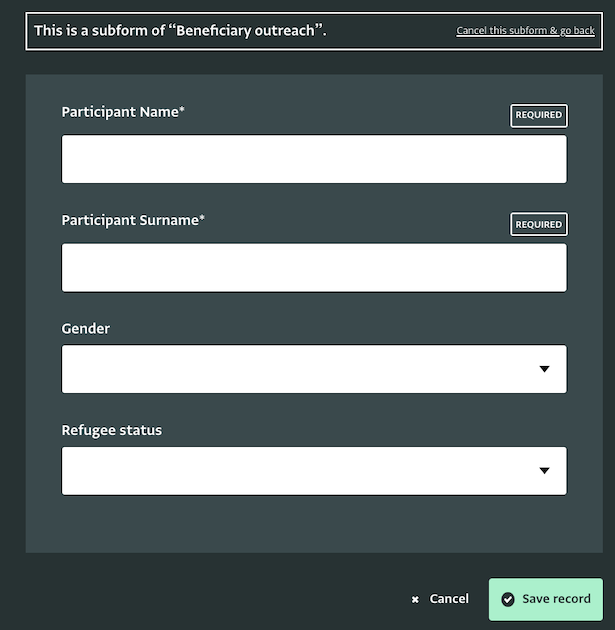
You can customize the form to adjust the information you will collect by clicking on the ‘Form settings’ button on the Table View of the form. We have added some records in the form and subform. You can edit or delete these records or practice with them. As you and your colleagues start adding data to the form you will see new records appearing in the Table View. You can also click on ‘Map’ to display the data on a map.

Collect all qualitative material in one place
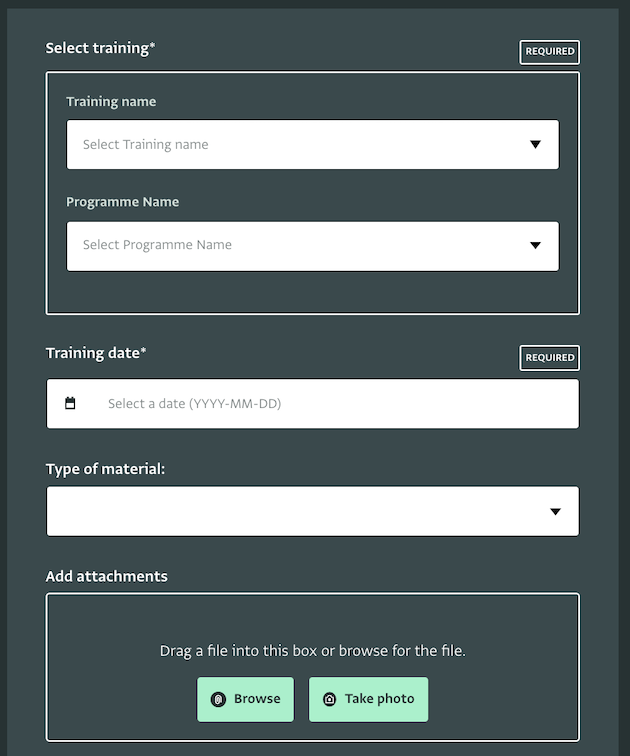
Using the form ‘Inventory of qualitative material’ you can add as attachments various types of documents and images for each training. You can also add one record for each type of material to make categorization easier. You can edit the form to adjust it to your needs by clicking on the ‘Form settings’ button on the Table View of the form.
Run an anonymous post evaluation survey
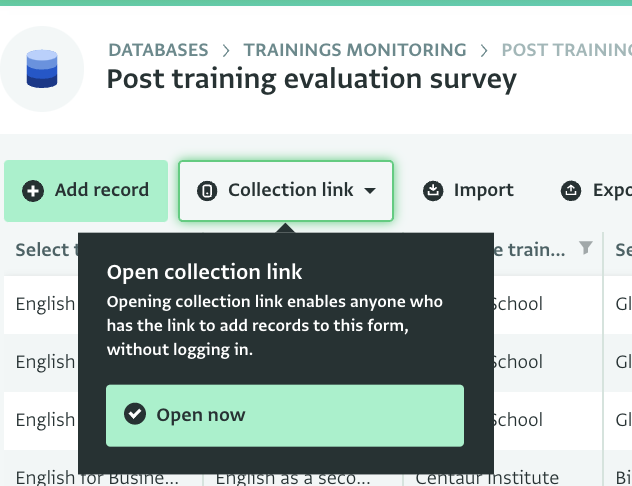
After completing a training session you can invite participants to fill in a survey about it using the ‘Post training evaluation survey’ form. The training participants don’t need to be users of ActivityInfo to access the survey. You can open a collection link to that form and share the link with participants to collect their answers. To open a collection link, navigate to the Table View of the form and click on ‘Collection link’ and then on ‘Open now’.
The form uses some calculated fields to help you assign automatically a score to each respondent based on their answers to the Likert scale questions. These fields won’t be visible to the respondents but you can access them via the Form settings and in the Table View. It also uses some calculated fields to automatically calculate the age of the respondent based on their answer and to assign them to a Date range category.
The form contains some dummy data with which you can practice. You can delete all records or change the form fields via Form Settings to meet your needs before sharing the collection link to collect responses.
Create a pivot table to measure beneficiary outreach
Once you have collected some data in the 'Beneficiary outreach' form, navigate to Reports and click on ‘Add pivot table’. Select the ‘Beneficiary outreach’ form to create a pivot table for the data collected in that form. Make sure to include the ‘Participant list’ subform too.

Then, add as Measures the ‘Count of all records’ card from the Participants list form and as Dimensions (in Rows and Columns) the Gender, Refugee Status and any other dimension you want to explore (e.g. City, Institution, Trainer).

Create a pivot table to measure satisfaction from the post evaluation survey
After you have collected some responses from the participants of your trainings you can create a pivot table to analyze the data. Navigate to Reports and click on ‘Add pivot table’. Select the ‘Post training evaluation survey’ form to create a pivot table for the data collected in that form.
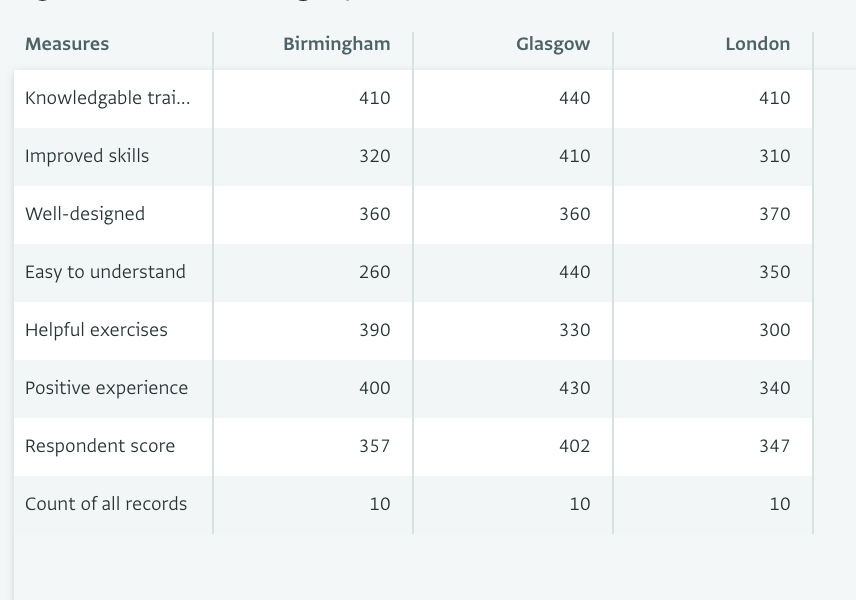
You can create a pivot table to present the average score of each statement in the Likert questions. Then, you can break down the data based on the age ranges of the form and add the City as a dimension to understand better how each location performed.
The first step is to add the scores of each statement, as measures. In our example, these are the fields with the names ‘Score Q1’, ‘Score Q2’, ‘Score Q3’, etc. Then, you need to select the correct statistic for this case, which is the AVERAGE statistic. Finally, you can improve the labels of the measures, so that the pivot table becomes easier to read.
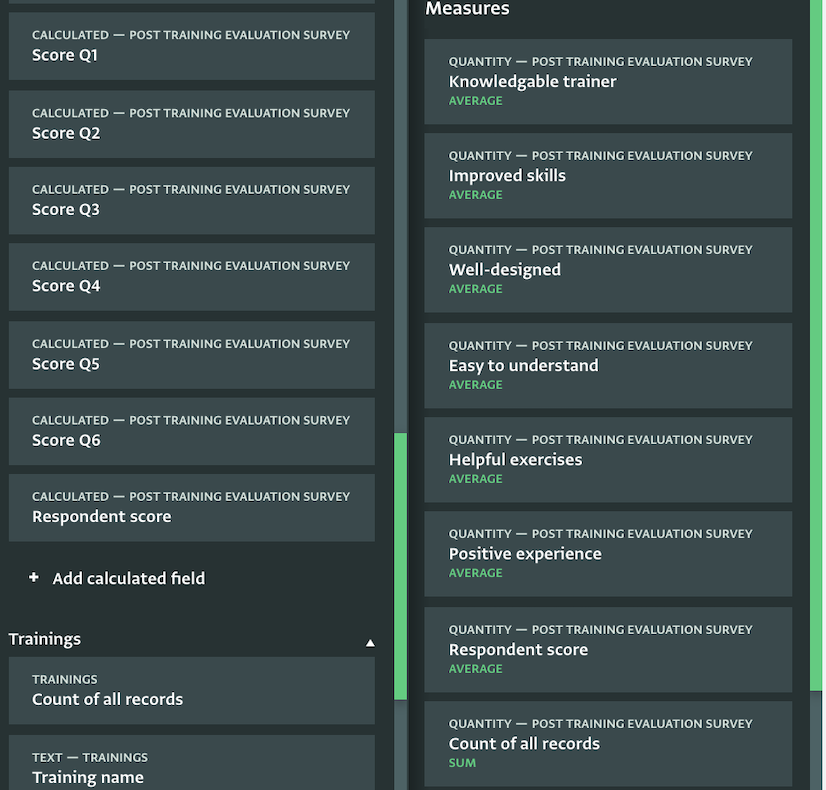
This gives us the average score of each statement based on all the respondents’ replies. Then, add as dimensions (in the columns) the age range and the city to break down the scores based on that. You can also use the gender to disaggregate the data further.
In every disaggregation, it is important to know the sample; that is how many respondents belong to each group. You can easily add it to the pivot table by adding the ’Count of records’ field to our measures. If the sample is too small, you might consider removing one of the disaggregation to view a higher level result.

Well done!
You have created a complete database for monitoring your training activities. You can always add more forms and reports based on your requirements.
Don’t hesitate to contact us if you need help setting up more forms for monitoring your training activities in ActivityInfo.