Global M&E database template for indicator tracking
ActivityInfo can be used to simplify indicator tracking for the whole organization. When managing many projects, it may be practical to collect only the key indicators you wish to track for each project on a regular basis, rather than trying to integrate all the raw project data into a single information system.
This template includes resources to help you build an indicator tracking system using the ActivityInfo software. It leverages the relational database model and reference fields, subforms, calculated fields and many more features to help make global indicator tracking as efficient as possible.
In it, you will find forms that allows you to add projects, the logical framework for each project, and its indicators, and then collect monthly updates on indicators for each project.
After you copy this template, you can customize the database, forms and fields as well as add records to meet your needs. Click on the button below to add the database to your ActivityInfo account. If you don�t have an account with ActivityInfo, you will be prompted to start a Free trial.
Create your own database based on this template
Learn more about the Global M&E database template for indicator tracking, and practice with us in our Webinar "Using the Global M&E database template in ActivityInfo". You can also explore best practices for developing indicators.
If you need support on using the software ActivityInfo for a different setup for indicator tracking you can always contact us and we can help you with a more tailored approach.
Customize the reference data: Strategic indicators, Partners and Countries
In the "Reference data" folder you will find all the reference forms such as Country, Partner and Strategic indicators. Thanks to the relational database model, your indicator tracking forms will easily link back to those, so you can always select from a standard, ready made list of options.
You can add or modify the existing records here individually, or delete all records (Shift+Click) and then import your own lists.
You can also add more reference forms or change the reference forms structure so as to collect different information by clicking on "Form settings".
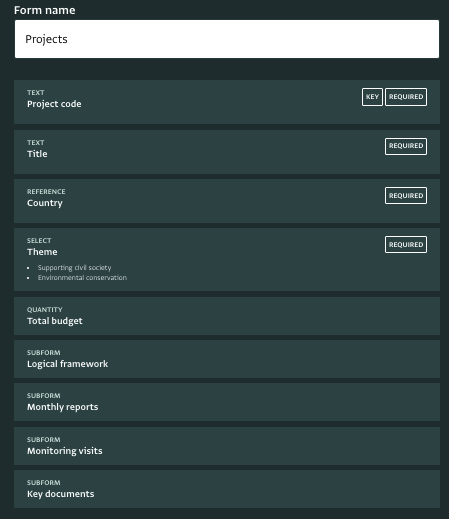
Customize the Projects form
You can optionally customize the Project form to reflect the tracking needs of your organization. The form links to the Country reference form to help users quickly find a country from a list during data entry.
It also uses Subforms to help you collect additional information about each project such as the logframe, monthly reports, monitoring visits updates, and other key documents.
Customize the subforms
Inside the Project form you can find various subforms that allow you to collect additional information about each Project, and also track the indicators for each project.
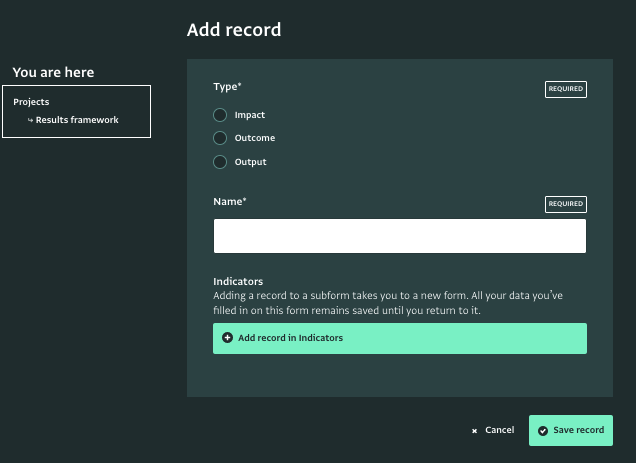
- Logical framework: Here you define if you will be working with an Impact, Outcome or Output indicator and you provide its name.
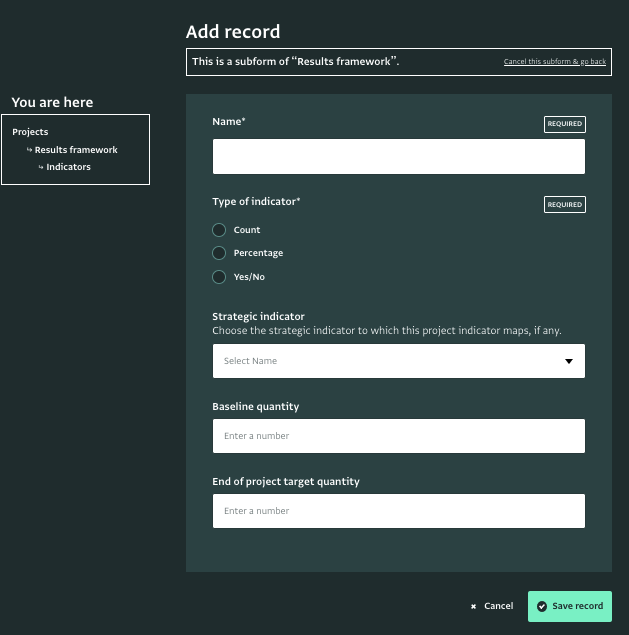
- Indicators: This subform exists inside the Logical framework subform. Here you can define the indicator further. You can define to which Strategic Indicator it is related to, the indicator's frequency of reporting, the indicator's baseline, and the indicator's target. If there is more information that you need to collect about the indicator, you can always edit the subform and add new fields.
- Monthly reports: With this subform you can collect qualitative information about the Project such as reports on its progress per month.
- Indicator-based performance assessment: To facilitate indicator tracking for each month, in this subform that can be found inside the Monthly reports subform, you can provide a value for the indicator as well as explanation for variance or delay. Thanks to the relational database model, the subform will link directly to the Parent form and allow you to easily define the indicator for which you are reporting. This will automatically bring up its Baseline and Target values via the use of Calculated fields.
- Monitoring visits: This subform can be filled in, if the project requires monitoring visits. Here the monitoring team can report on the project's progress on specific dates.
- Key documents: If there are important documents related to the Projects and the indicators, you can add them in this subform.
Invite your team
Navigate to "Database settings" and then "User management". You can click "Add user" to invite a team member to access the database. This template is configured with three roles:
- Administrator: can make any change to the database, including customizing the forms
- M&E Specialist: can make any change to the database, including customizing the forms
- Data entry: can only view, edit, delete and export data
You can easily edit the roles to meet the needs of your team. Click on a role and then click on 'Edit permissions' to open the list of available permissions. Select the ones you want to keep and click on 'Save'. You can also add new Roles.
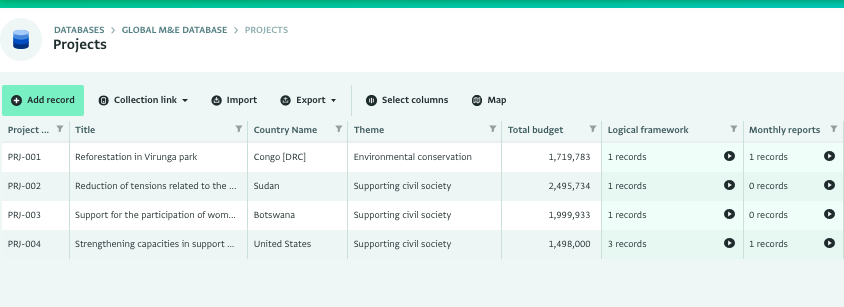
Add data about your projects
Navigate to the 'Projects' form and click on add record to add a new Project. You can also modify records here individually, or delete all records (Shift+Click) and then import your own lists.
To add your logical or results framework, select your project from the list and open the subform 'Logical Framework'. Then click on 'Add record' to start designing it. You can also add the indicators that you wish to track which are related to each impact or outcome or output.
Review your projects
As you start working on the project form, you will see new records appearing in the Table View. You can filter and sort these records based on your preferences to work faster.
Another option you have is to use the Map View to view all of your projects on a Map.
Analyze your data for a complete overview of your indicators progress
You can proceed and analyze your data creating pivot tables and charts, overviews using Dashboards and longer reports using Notebooks. Take a look at our resources to get started with data analysis and reports in ActivityInfo and create a powerful indicator tracking system for your organization.
For further support on using the software ActivityInfo for a different setup for indicator tracking you can always contact us and we can help you with a more tailored approach.