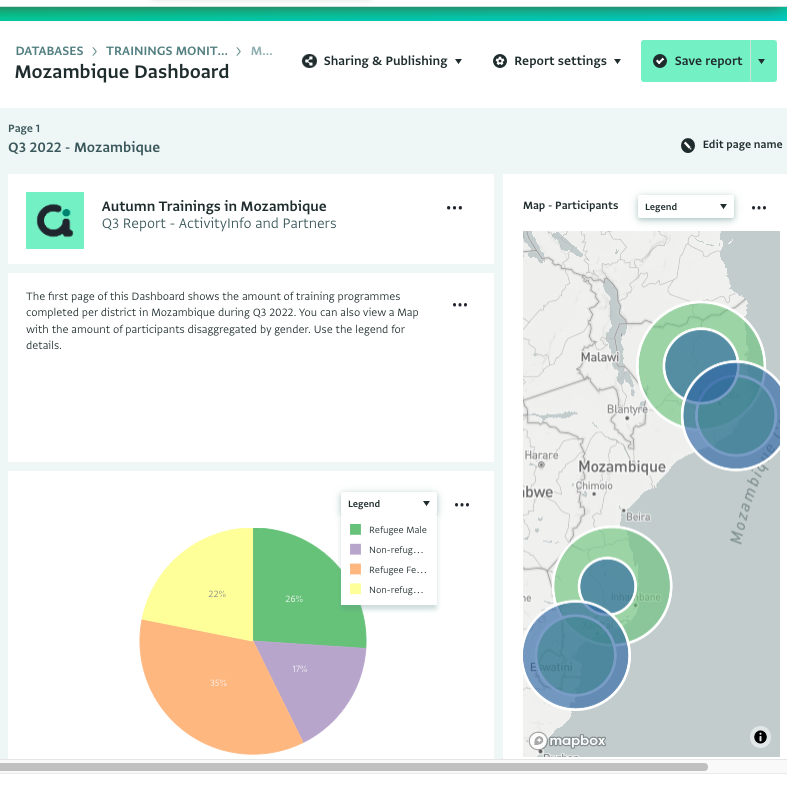
A Dashboard is a Report layout that allows to put together a collection of tables, charts, and maps along with text and section headings in a grid.
The Dashboard layout allows administrators, data analysts and decision-makers to combine individual analysis and visualizations so as to quickly identify issues and problems for attention, at a glance. In the Dashboard layout, visualizations are more compact and dense compared to the Notebook layout.
You can design Dashboards by adding components.
If the component is an analysis, you can go back to the Analysis View of the component to continue working on the analysis.
