The use of ActivityInfo in the Ebola Response by UNICEF in the Democratic Republic of the Congo

The first version of ActivityInfo was developed during the Emergency Response in the DRC, in 2009, as a result of the need to coordinate the reporting activities that a large number of partners performed across multiple provinces and sectors.
Since then, UNICEF in the DRC has extended the use of ActivityInfo to monitor the activities in other programmes too. A decade later, UNICEF in the DRC coordinates more than 30 partner organizations reporting their activities for the NFI-Shelter Cluster and 9 partner organizations reporting for the Rapid Response to Population Movement (RRMP) programme. More than 500 people are reporting on activities using the platform. In November 2018, the organization started using the software for monitoring activities related to the Ebola Response too.
We spoke with Mr. Ambroise Brou, Information Management Specialist for the Emergency situation in UNICEF DRC and Mr. Patrice Fillon, Information Management Specialist in the Ebola Response in UNICEF DRC who explained to us how ActivityInfo is used today by the organization and in particular in the Ebola Response.
Collecting indicators regarding the Ebola Response
The Information Management Unit of UNICEF in the DRC uses ActivityInfo to collect information from partners regarding two key areas of the Ebola Response strategy.
One area includes the Water, Hygiene and Sanitation (WASH) activities which are performed as part of the Infection Prevention Control. Another key area includes the activities related to psychosocial support to survivors and family members of Ebola Virus Disease (EVD) cases.
Two separate databases have been created in the platform for each key area of the Response. Each database collects information using multiple forms. All UNICEF partners report their activities using these forms.
The IM team in UNICEF DRC is currently developing the databases for the activities of two more key areas of the Response; Risk Communication and Community Engagement and RCCE/Education-Nutrition as cross-cutting sector.
The WASH Database
A total of 14 partner organizations collaborate on the WASH database since November 2018. They do data entry on 5 ActivityInfo forms and they report on indicators regarding a variety of WASH activities taking place close to areas affected by EVD cases.
Some examples of these indicators are the number of households, health centers, schools, churches and public places around the affected area, the number of children and teachers who have received information on how to protect themselves and prevent the spreading of EVD, the number of households that have received hygiene kits, the number of handwashing stations available in churches, public locations, the number of toilets, showers constructed in health centers and more.
Also the database collects information regarding the impact of the activities such as the number of people who have benefitted from certain activities (e.g. the improvement of sanitation facilities, hygiene promotion sessions, and more).
The Psychosocial Database
Since April 2019, 7 partner organizations, including the Ministry of Health collaborate on another database created for monitoring the activities related to Psychosocial support to EVD survivors and family members of EVD cases. The partner organizations and the government use 5 ActivityInfo forms to report on indicators regarding the psychological support in the Ebola treatment centers, activities in creches, the support to the affected families, the support to orphan children or children separated from their families, and psychoeducation.
Some examples of these indicators are the number of men, women, boys and girls who are suspected, confirmed or healed EVD cases and have received psychological support, the nutrition kits distributed in the creches, the number of people receiving psychological support, the material assistance provided (e.g. hygiene kits, alimentary kits, nutrition kits etc.). Other indicators track the number of support material (such as alimentation, school supplies and costs) provided to orphan children or children separated from their families and the number of psychoeducation sessions given to affected people.
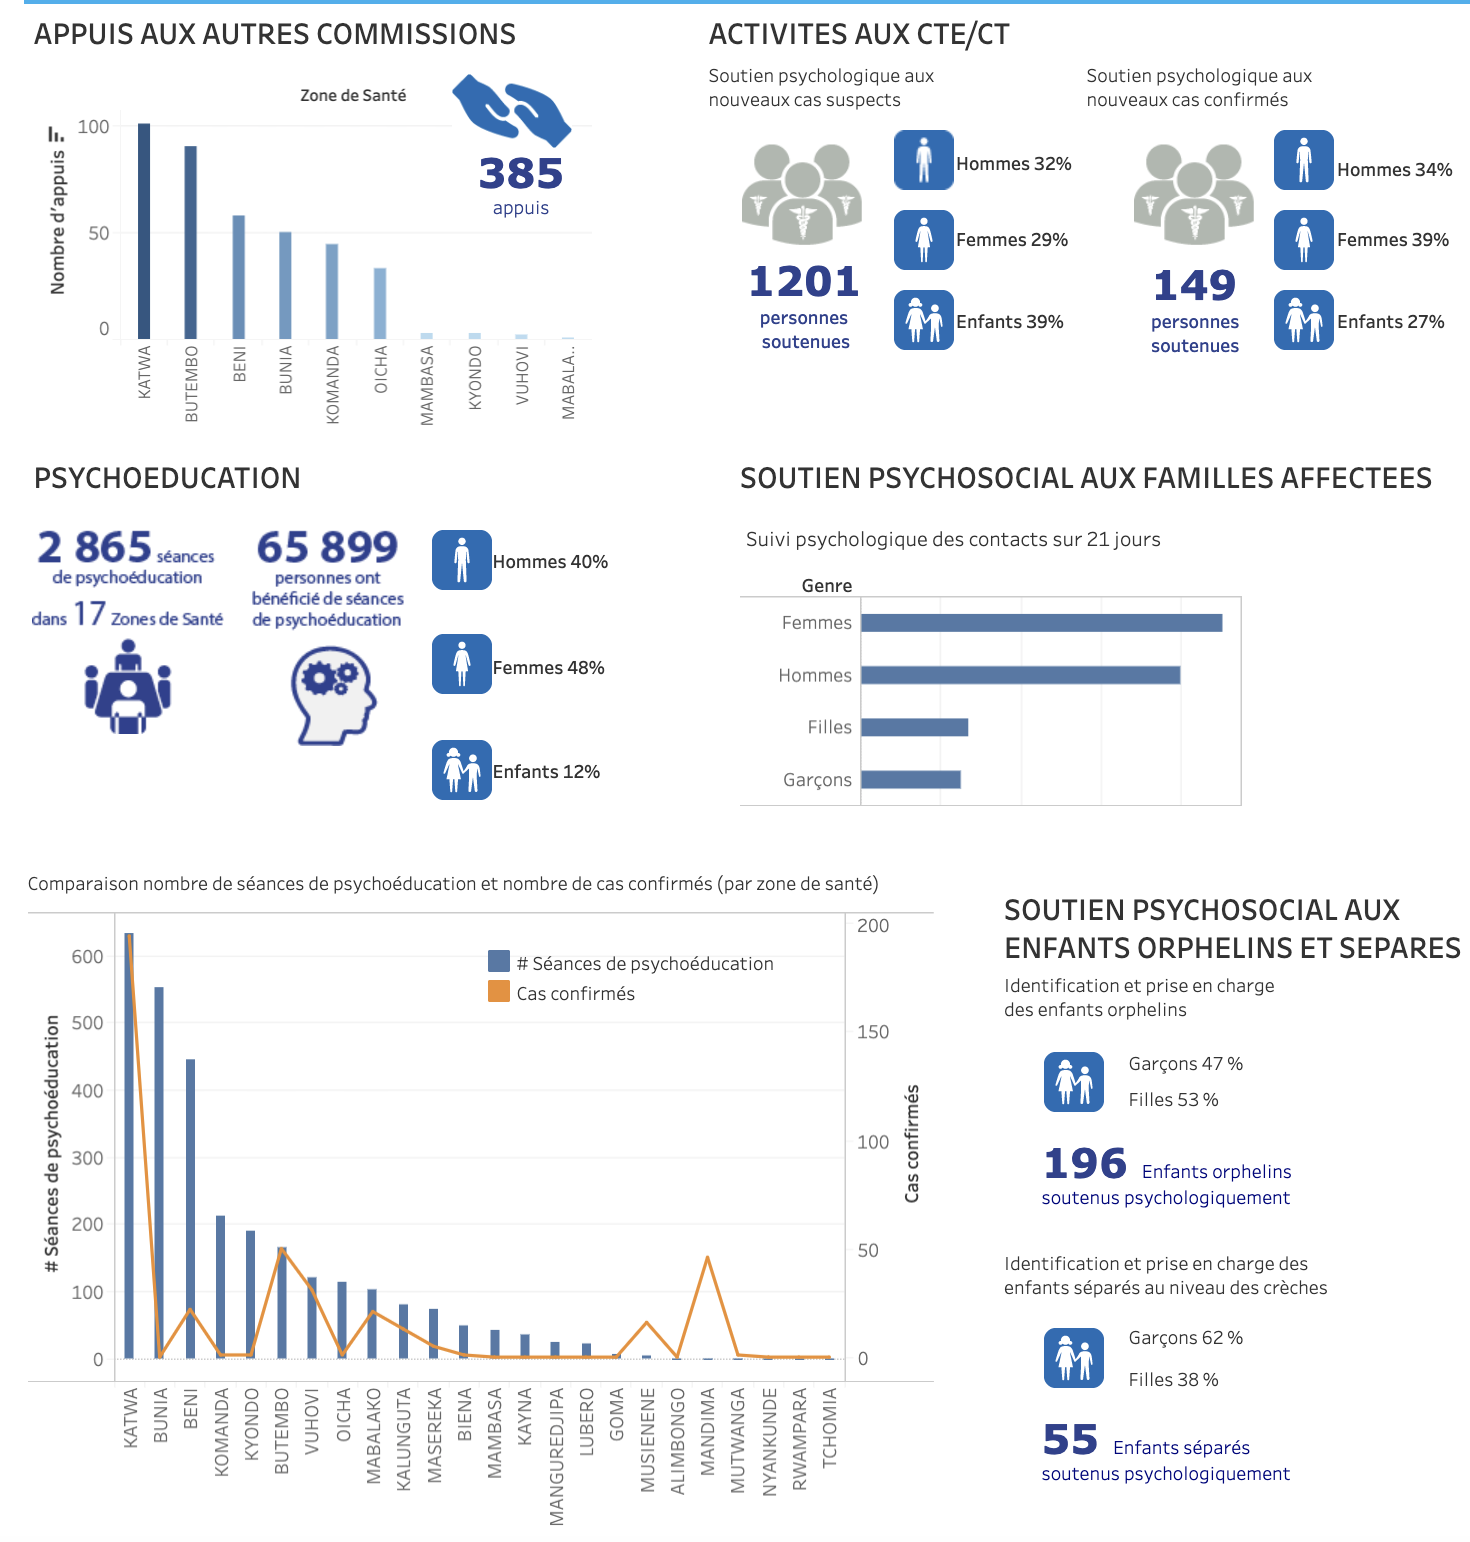
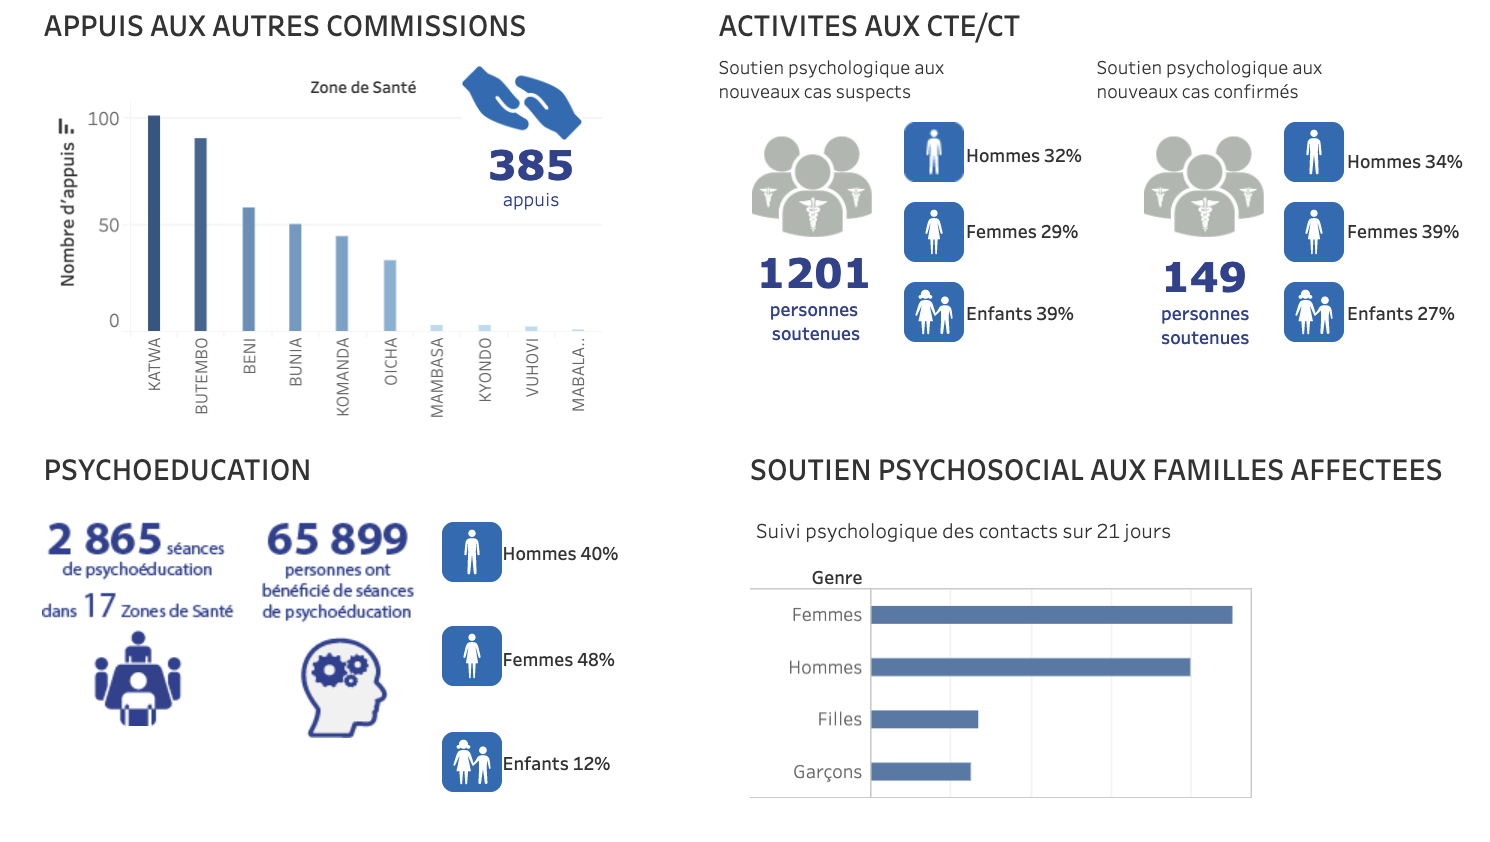
For an overview of the activities and the Response for April 2019, you can have a look at the interactive Dashboard that was created by UNICEF DRC. The Dashboard has been created with the visualization software Tableau and is based on the data collected in ActivityInfo.
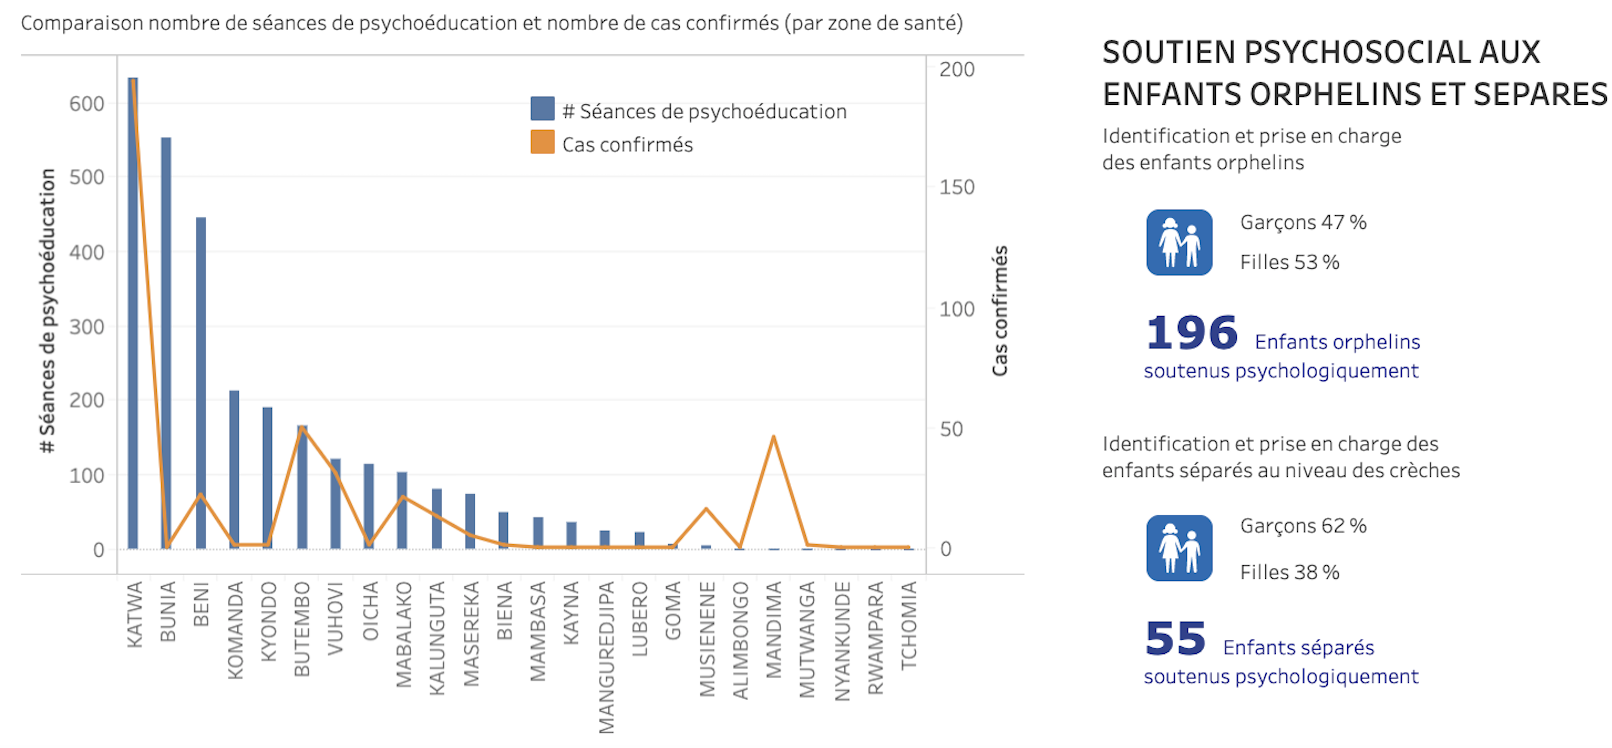
The informative Dashboard presents a variety visualizations on the Response. It presents the number of people who have received support in various Zones de Santé, the number of people who have received psychological support in the treatment centers, the psychoeducation sessions and the number of people who benefited from them as well as the number of people who received support and belong to an affected family.

Also it presents a comparison between the number of psychoeducation sessions and the confirmed EVD cases per Zones de Sant?? and summaries on the number of orphaned or separated children that has received psychosocial support.

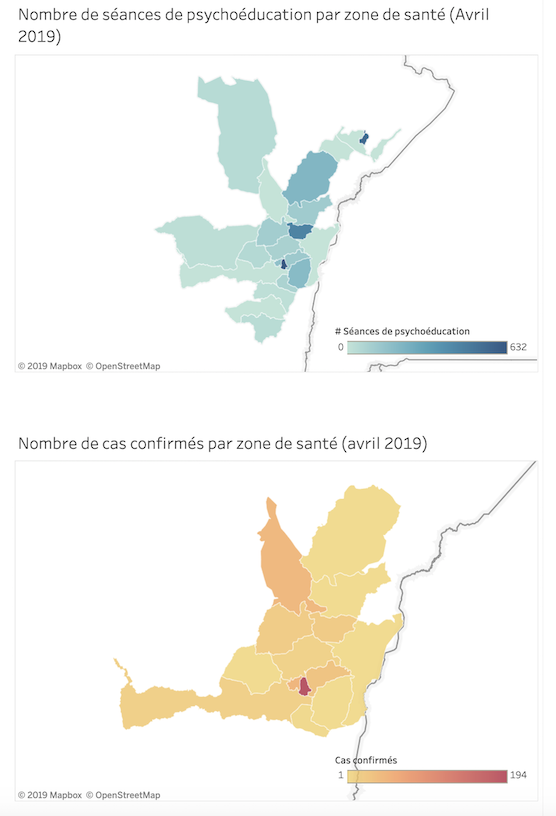
The Dashboard also includes maps that depict the number of confirmed EVD cases per Zones de Sant?? and the psychoeducation sessions that have taken place.

The Data Entry process
To make data entry as easy and fast as possible for their partners, the team of UNICEF DRC provides training to the partners and design the forms and the databases in such a way that all information is easily accessible and is classified in a meaningful way.
For example, the Forms in the Databases for the Ebola Response are short and correspond to the different Activities of the Response. This way less experienced users can quickly find the Activity they are reporting on and easily add their data. Also, data entry officers can use ActivityInfo in the French language.
As for the analysis of the data, in most cases the data is disaggregated based on gender and age in order to make it possible to track more easily the Response for more endangered groups such as women and children.
Finally, UNICEF DRC creates reports using either the reporting interface of ActivityInfo or other visualization software to create static or interactive dashboards based on the data collected in the platform.
We would like to warmly thank Mr. Ambroise Brou and Mr. Patrice Fillon from UNICEF DRC who provided us with all the information for the creation of this blog post.
Would you like to know more about ActivityInfo and how you can use it to simplify your programme monitoring and evaluation? Don't hesitate to contact us.