Exploratory text mining with the ActivityInfo API; the QualMiner Project for the Emergency Response Plan

The ActivityInfo team participates in the exploratory research project, QualMiner which focuses on the challenge of handling the unstructured information reported by humanitarian organizations in the Emergency Response.
The project uses text mining and other text analysis methods to explore qualitative indicators reported in an ActivityInfo database. It is under the auspices of the UNHCR’s Innovation Fund and it is carried out in collaboration with 3 organizations; HIAS, Penn State University and the Information Management team of UNHCR in Ecuador and the Region. UNHCR’s Innovation Fund is an initiative that provides funding and support for experimentation to reinforce innovation and adaptability.
Currently the project is in the early stages of its first stage and the results which are regularly updated can be accessed on the QualMiner Github page.
The challenge to address: Qualitative indicators
Measuring qualitative indicators is a big challenge in the M&E process. Also, results based on qualitative data are sometimes given less weight compared to quantitative data; for example during the presentation of summaries and situation analyses. This often happens due to the amount of resources needed to analyze the former.
The Regional Coordination Platform for Refugees and Migrants from Venezuela is using ActivityInfo in the Crisis Response. They collect both quantitative and qualitative indicators. To collect qualitative indicators, their Forms include text fields to collect narrative input from their partners. The visualization of such unstructured information can contribute to better understanding and improving the data collection mechanism and the whole programme. It can also showcase the work of operational partners and funding agencies more accurately.
The role of ActivityInfo in the Qualminer project
During the first stage of the project, the role of the ActivityInfo team is to explore this unstructured textual data by using text analysis methods in order to create information products that will respond to a variety of research questions and assumptions on a monthly basis.
At the next phase of the project, the team of ActivityInfo will examine the feasibility of adding functionalities in the platform that can facilitate text mining for qualitative indicators.
The text mining process
So during the first stage of QualMiner, the data analyst of the ActivityInfo team extracts the data used in the narrative fields of the Forms used by partners, by using the ActivityInfo RESTful API. Then, the data is preprocessed and cleaned using a variety of techniques (such as cleaning noise in the text, tokenization, stemming and more).
Following that, the cleaned text data is summarized with associated metadata (e.g. locations, partners, etc.). Finally, a variety of analyses is carried out using text analysis techniques and the results are visualized using various methods such as histograms, scatter plots, box plots, word clouds and more.

Metin Yazici, Data Analyst working in the project gives his insights in the process:
“10% of the work is getting the data from ActivityInfo and 20% applying models and visualizing it. 70% is cleaning the data and making it ready for analysis. In general, this is the part that takes more time, not because you get dirty data from ActivityInfo but because you have to clean the data for specific analysis, you have to group them, aggregate them and prepare them, in general.”
The R language is used to manipulate, visualize and model the data. It has been selected thanks to its rich variety of statistical tools and the simplicity in which it allows data analysts to run statistical functions. Also, by incorporating natural processing libraries, the project is able to identify key aspects of the language (such as the common root of words) and group them together.
Examples of analysis in the Qualminer project
The analysis explores a variety of aspects related to text. The different assumptions that are examined every month can be reached in the QualMiner Github page.
An example is looking at the answers given to narrative questions and exploring the relation of the word count with other criteria such as locations (provinces, cantons, etc.). Another example is exploring the use of common words in relation to partners and locations.
Another exploratory aspect of the analysis has to do with the relation of the word count of narrative fields (i.e. answers given) and the quality of answers. By using text mining the project attempts to prove or disprove the assumption that the longer the answer the better. The quality and the length of the answer can then be correlated with the number of words used in the questions and the existence - or lack of - a Description field accompanying the question, as well as the length of the text in such a Description field.
The use of the results
The project will be completed by the end of the year and then more results regarding the analysis will be shared. Also the initiative can be easily replicated in other regions and for other programmes, following its piloting in Ecuador.
In the meantime, the project partners plan to use the results of each month to get feedback and insights from the relevant stakeholders and collaborate with each other in order to improve the research questions and the field staff performance as well as the actual data collection forms and processes. This way the Response Mechanism can become faster and the flow of information smoother.
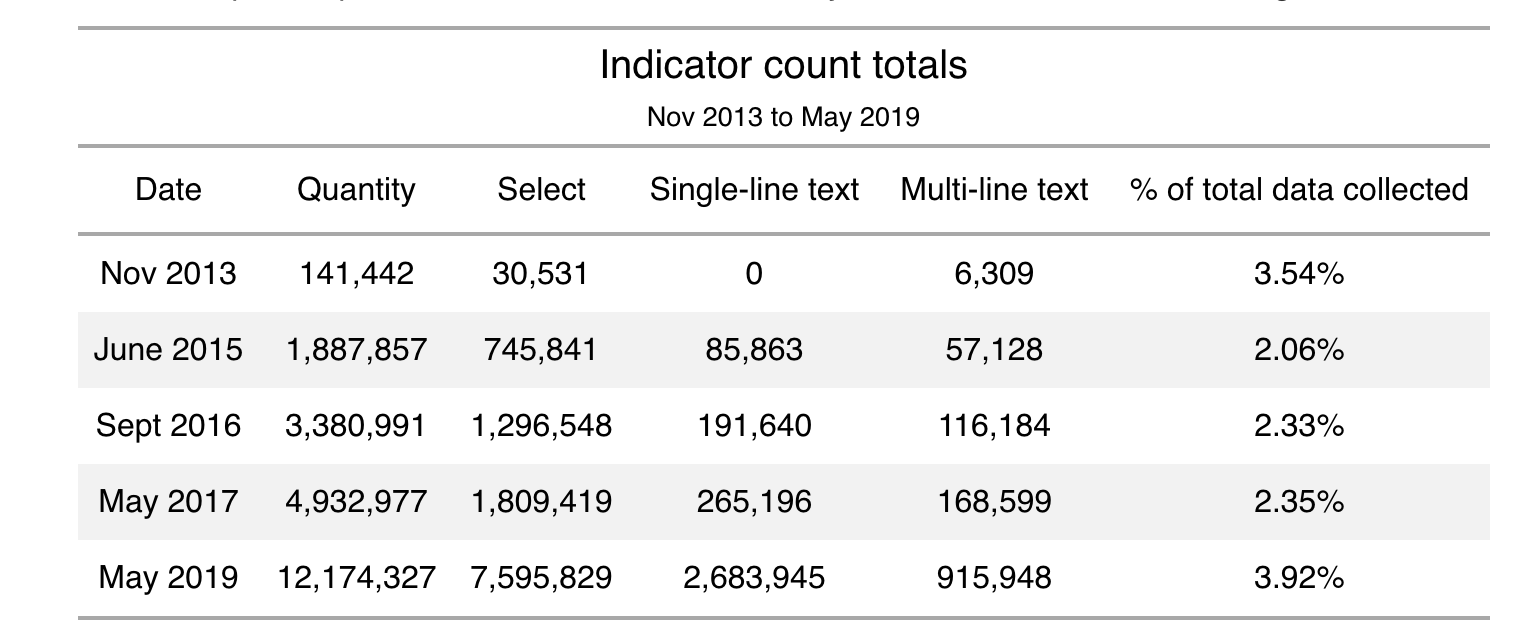
As the project progresses the ActivityInfo team will be examining the addition of new features in the ActivityInfo software itself with the aim to make the analysis of qualitative information easier. As the following table shows, there is a steady increase in the amount of qualitative indicators collected (single-line and multi-line text) throughout the years.

Alex Bertram, the founder of ActivityInfo comments:
“From the perspective of ActivityInfo, it shows a clear need for new tools to support analysis of qualitative data as the absolute volume of qualitative data has increased by a factor of 150, and almost doubled as a relative share of all data collected.”
Would you find such tools useful? Let us know your thoughts!