Levels of Analysis in Information Management: how and how much to track
In our previous blog post we explored the concept of the LogFrame and that of an Information Management System and we analyzed their purpose. We also presented the role of ActivityInfo in Information Management.
In this blog post we take the next step towards understanding how a successful Information System should work, taking inspiration from our current users.
Sometimes, when we are working with new organizations to help them set up ActivityInfo in a way that serves their program needs, we hear the famous phrase "We just need to track one number for our LogFrame".
Although this sounds as a simple and easy task to do, there are certain things to keep in mind before moving on. To do so we ask the following questions:
1. Is it indeed just one number?
Even though a LogFrame might ask for one high level indicator to be tracked, it is very important to understand that this high-level indicator might derive from many other indicators that must be collected in other levels of analysis (i.d. at the Activities level, at the Output and at the Outcome level).
So the first thing to do is to understand what the high level indicator stands for and what is needed to calculate it. To do this, consider what are the other numbers - indicators - needed to help you reach that indicator and analyze these numbers as well.
Then do that for every level of the LogFrame until you have a clear understanding of what needs to be tracked at every level. The following tips can facilitate you in doing this:
a. Analyze the high-level indicator
High level indicators are usually the ones which are the most difficult to track. That is because they might need some work done in order to get them. The best way to approach a high level indicator is to ask what is behind it. Write down what you need in order to track this number.
Ask all the questions needed and give the respective answers. If you are working with Partners and they are responsible for providing you with that numbers make sure you have defined a consistent and clear way on how they should report their numbers to you.
Make sure they cannot access and edit the data reported to you without your permission after a deadline and that there are no duplicates in their reporting documents.
b. Analyze the percentages
When you have an indicator in the form of a percentage at any level of analysis, make sure you understand what the percentage is about. Figure out which two indicators are needed to calculate this percentage and make sure you or your partners track them in a proper way.
c. Identify the units of analysis
Make sure you have a clear name for what you want to collect for each level of analysis. The quantitative indicators need to be named based on a unit of analysis. This will also help the people collecting the data as it will make clear what exactly they must look for.
d. Decide on the data points
Before starting the data collection, it is important to decide which data points will be used to collect the data. Are these data points reliable? Are you capturing and storing the actual numbers? Then make sure that everybody collecting data uses the same data points to ensure consistency.
- Revisit indicators that are hard to get
If there is no way to track an indicator maybe it is not the correct indicator. Try finding another indicator that is viable to collect.
2. How will I track this information?
Once you know what indicators you need to track for each level of analysis, it is important to decide and define the way in which you will track the information needed for each level. Maybe it makes sense to use a centralized system for all the indicators, beginning from the lowest level and moving to the highest level. Or maybe there is no actual value in tracking everything in one place, instead such a venture would make your process more cumbersome.
An example to examine would be the Clusters and the way they are tracking information for programs that run in a multitude of locations and call for the collaboration of many partners. Sometimes, the partner organizations gather the Indicators regarding the Activities on their own Information System and then they report their indicators to the Cluster Leader who is collecting these lower level indicators from all the partners and aggregates them to produce the high level indicators. The partner's Information Systems might vary from Excel Sheets to Reports written on paper. The Cluster Leader would need to make sure that these data is properly collected in order to be able to produce the indicators required for the higher level of the analysis.
In this workflow, the Cluster leader who is also accountable for the overall progress of the Program or the Response might not have easy access to the way the Indicators of the Activities were collected.
3. How much of the information I track needs to be on an online Information System?
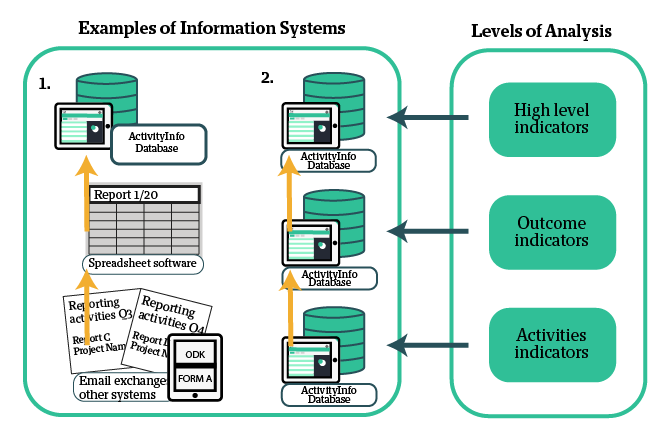
Considering the same example of Clusters, we will examine how ActivityInfo can be used to track any levels of analysis needed.
In some cases ActivityInfo works as the top layer, with each cluster member maintaining their own information system which then feeds into the Cluster Database. This causes some duplication of effort and inefficiency, but is most likely unavoidable as each organization operates differently and designing and imposing a unified system at the beneficiary level across 20 - or 100 partners would be far more costly.
On the opposite end of the spectrum, ActivityInfo can be used at every level of the system, from data collection on mobile devices to executive dashboards. Take a look at the example of how the AIP Foundation adopted ActivityInfo in five offices across four countries to monitor their program at all levels.
Summing up, although tracking that one high level indicator might not be the easiest task to carry out, having a clear plan of what to track and how to track it can inherently decrease the difficulty of the task.
ActivityInfo is a result of the need of thousands of humanitarians worldwide to track and report on data in a flexible way. This flexibility allows humanitarians to use the software both for high level aggregation of multiple indicators coming from various partners and for collecting low level indicators for Activities in the field.
If you are interested in a more thorough walkthrough on building a complete data collection system for Monitoring and Evaluation activities, please consider taking the online, free self-paced course "Mastering the basics of information management with ActivityInfo".