Logistical follow up in ActivityInfo, allowing for improved service delivery
During an emergency, timely follow up with logistics is crucial. No program can run without logistical back-up: plumpy nut in stock, cold chain in order or bednets in store. However, all of us who have been working in emergencies have faced ruptures. This could be due to complex lead times, local travel conditions or a lack of staff. If you are not an implementing partner yourself, but supporting implementing agencies and partners, you would like to follow up and support where possible. ActivityInfo can help logistical coordinators and agencies with these tasks.
Logistical coordinators in headquarters, or in distribution hubs often calculate the expected consumption rates and work with orders as received from the field offices or by partners. However ActivityInfo would allow you to do more; be pro-active and upfront in resupplying your partners and field offices.
Imagine your organisation (or cluster) is using ActivityInfo for the follow up of the projects and plans. You can provide access to your logistical coordinator (“view all” rights in the user management panel). The Logistical Coordinator will from that moment be able to see in real time the actual distribution of (for example) the plumpy nut in health centers, the bednet distributions in villages, or NFI kits being distributed.
If you are working in an emergency, you will not be the first encountering a rupture of one of your goods. Maybe there is just no logistical manager due to the small scale of the organisation, or when working with local implementing partner. By providing access to the program data to the logistical coordinators by program staff, they can themselves follow-up too based on data that is already reported by others.
All they (the logisticians) need to do is create their own database and start reporting! We have seen this logistical follow up in ActivityInfo in several countries. A logistical database where logisticians record WHEN a TRUCK (which company for example if they wish to do other analysis too) have been send WHERE to WHOM. Logisticians can then set up their pivot tables, checking how much has been sent and how much has been handed out (program data). By analysing this table, the logistical manager can see up front how the levels of stocks are in each location or from each implementing agency. Having this overview puts logisticians in a pro-active seat. If they see that there is lots of plumpy nut being hand out and knowing there were only 10 boxes in the last truck; they can simply pick up the phone. Calling to check in, if they envisage to continue these distributions over the coming weeks; and if so to send a truck up front with new supplies when possible.
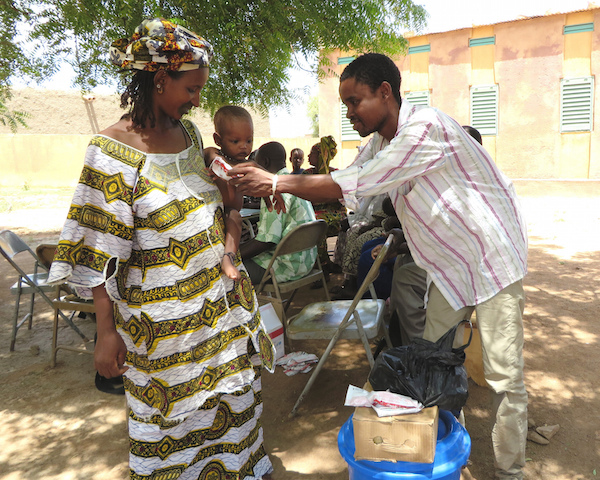
Example: RUTF Logistical follow up for Malnutrition Programs in Gao Region Mali
(RUTF: Ready to Use Therapeutic Food)
Imagine you are working as a logistical coordinator for a large agency with its headquarters in Bamako, Mali. You are working with implementing partners. In the Gao region you are working with two implementing NGOs called NUT and AfNS. NUT started their malnutrition program in February 2017 and AfNS started a month later, in March 2017.
Your agency is already using ActivityInfo to follow up and monitor the programs they run in partnership with the implementing partners. As logistical coordinator you have been granted access to the program data in ActivityInfo. You have also set up your own databases where you keep track of the trucks send to the regions and NGOs, and what has been sent. Therefore you are able to follow up the stocks and activities in real time.
For this example, the lead time (time needed between sending and receiving) is only 3 days, hence we do not need to plan additional stock for long lead times.
Creating a simple pivot table will provide you with the information you require. You generate a table in which you can analyse how much you have SEND to each NGO in the Gao region, as well as how much they have already DISTRIBUTED, see below. By early April you have not yet heard from either of the agencies regarding any supplies request. Opening the table (see above), it gives you real time data and information regarding their stocks.
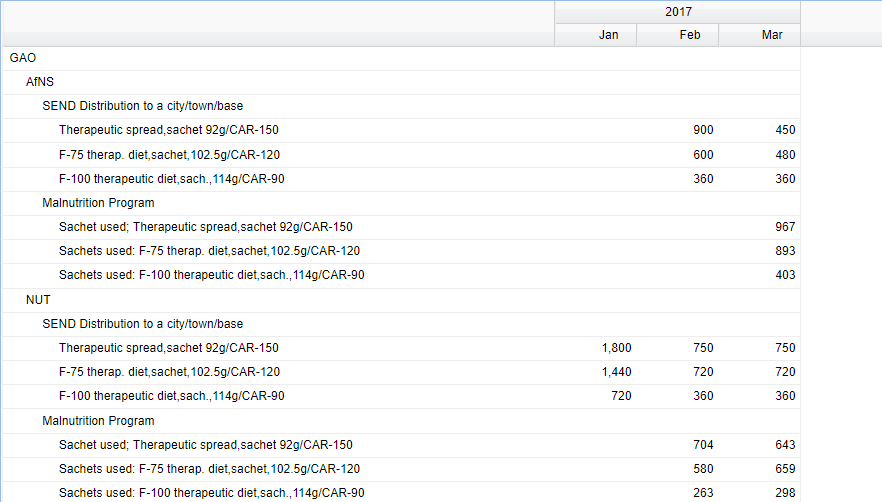
A quick glance tells you that the NGO NUT is still doing fine and there is no need to worry just now, since there is still enough in stock for another two months given their current distribution and consumption figures. Their initial supply has been envisaged to be for two months, and their current distributions is approximately as planned by their monthly re-supply from your headquarters.
However the situation AfSN is very different. They started their activities a month later, but a quick glance on their first program data tells you that they have used up their first supply of goods (which was planned to be for two months). They have also already used up a lot of their last supply, since you have not heard from them yet you are going to call them, and prepare for a truck to be sent along with other goods you were planning to send to Gao this week.
Before you call, you quickly open up the weekly distribution of AfSN too, to see if there is some trend to be seen, which might further provide you with information on the quantities to be sent.
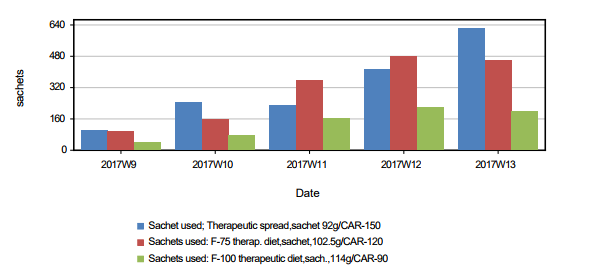
The urgency of your call becomes even more apparent when you visualize the data by week. Two weeks ago the consumption doubled and last week even tripled. This would mean with their current stock levels there is only for one more week left in stock, instead of the three weeks which you assumed based on your first pivot table!
Making smart use of data that is reported anyway, really allows for a transition towards further improving service delivery to the beneficiaries in crisis situations. Like in this case for logistical follow up. Furthermore it will add to the improvement of your partnerships and collaborations both within your agency (between program staff and logistics), as well as between you and your partner organisations.
We are looking forward to hear from your use cases, please let us know if you wish to blog or share your stories of ActivityInfo use on our website!