ActivityInfo - Changing the Way Humanitarians Monitor and Report
Introduction
Humanitarian organizations gets a lot of flack these days for not being as efficient as the private sector, nor innovative, nor results driven, nor offering sufficient equity risk premium (or is that blurring the lines too much?). Although these comparisons are usually skewed or unfair in my opinion, there is one area where the playing field should have and can be levelled, namely IT solutions, particularly for monitoring and evaluation. As the private sector is venturing towards a brave new world of ‘Big Data’, the humanitarian sector is still struggling with just... data. The current system of storing and sharing information is both resource intensive (in terms of time and money) and leads to suboptimal outcomes in the quality of our programming as a result of data loss, lack of information sharing and lack of analysis.
Luckily there are plenty of humanitarians out there advocating for better tools which might help reform the system and a few with actual software development skills (not me unfortunately) that are trying to make it happen. ActivityInfo is one of the fastest growing solutions in the form of monitoring and evaluation software which can be used at all levels: from M&E Officer in the Field to the Global Nutrition Advisor at HQ. It offers centralization, integration and standardization of data, as well as powerful analytical tools with mapping capabilities that do not require flying in an experienced GIS team. The following is based on my experiences in the field; some of the challenges I faced and how I believe that the widespread adoption of ActivityInfo can make life both easier for humanitarians and better for the people we intend to serve.
Current State of Affairs
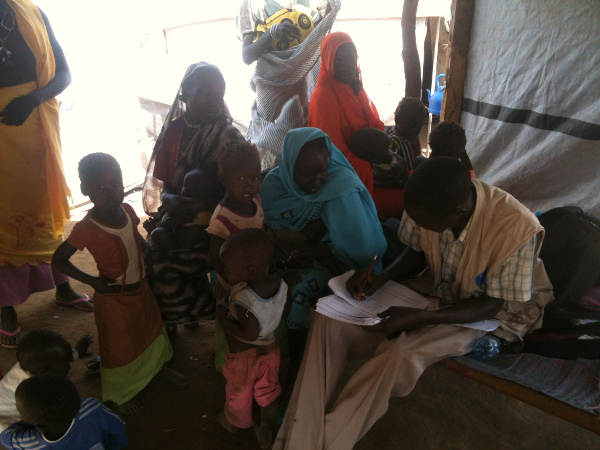
I have recently returned from a deployment in Maban, South Sudan, where I was fortunate to work alongside some very inspiring people; some with extensive experience, some with little, but almost all passionate about the work they do and committed to putting in long hours in order to get the job done.
Although inspiring, it was also strangely disconcerting to see how many of those long hours went into important (from an accountability perspective), yet ‘unnecessary’ relaying of information. I have not come across research regarding the percentage of time spent by managers and coordinators in the humanitarian sector on both internal and external reporting, meetings and requests for (program) information, but in my experience it can take up to and over half their working hours. This is not due to the faults of any one organization, but rather it is a result of the way the collective reporting system is structured, as a reflection of the tools we currently use and the way in which we share information.
Sharing of information becomes ‘unnecessary’ the moment that same information must be manually reformatted in order to share it a second, third or fourth time, whether written or orally. Unfortunately, this is inevitable, as it is a result of the way in which we currently store information:
- Non-digitally - a surprising amount of information in the field is still stored in (for some reason usually dusty) filing cabinets without being transferred to electronic versions. In addition, most information regarding project specific progress and contextual influences are relayed orally within program teams without being recorded.
- Digitally - although most information is now entered into computers, this is still primarily done using excel sheets (for quantitative information) and word documents (for qualitative information). The excel sheets are usually designed in the field, to suit local needs, and data is usually divided across compartmentalized files covering a specific timeframe such as a week or a month.
As well as our current mediums of distribution for such information:
- Orally - a lot of information is still shared in this way and more often than not during social settings such as the local pub. However, during coordination meetings, data, alongside contextual information, is often recited in a manner which sometimes can best be described as a boasting match rather than constructive joint analysis of trends and gaps. In addition, information is also given to other parts of the organization through phone or skype, for example, right before a big coordination meeting in the capital.
- E-mail - This great ‘new’ form of communication has made sharing information from the field to the capital or HQ many times faster than it was, for example, in the ‘80’s. Unfortunately, you will also hear many a veteran of the humanitarian sector complain about how much more time they seem to be spending in the office as a result, rather than in the field. This is by no means a phenomenon that is particular to our sector. Add to this however the humanitarian’s tendency to hit ‘reply all’ to a colleague’s farewell e-mail, as well as the angry responses requesting people not to hit ‘reply all’, as their inbox is becoming ‘pregnant’. It then becomes significantly less difficult to imagine why colleagues in their 50’s yearn for the good old days.
- Cloud Storage Services - Some organizations seem to be experimenting with this means of communication, which is less intrusive than e-mail, but it is not at all yet in common use.
Challenges
The problems associated to this current modus operandi are unfortunately not few in number:
1. Resource Intensive
This is by far the greatest issue arising out of the humanitarian sector’s current information management system and is more or less a culmination of the points mentioned below. As a result of our current tools not facilitating data centralization, standardization, integration nor analysis, and the means of distribution being very intrusive; relaying information has become a very time intensive undertaking.
Reducing each hour spent on ‘unnecessary’ relaying of information can be translated into either a very concrete dollar figure, or a more abstract amelioration of the quality of programs (or alternatively more time spent on non-program reporting). This is not even mentioning the time spent by field teams creating tools from scratch for each new emergency, nor the cost of hiring a consultant each time an organization wants to set up a one-off database, nor the inefficient allocation of resources due to coordination based on spotty data and superficial analysis.
2. Loss of Data
Depending on the phase of the emergency, most humanitarians remain in one field location for a relatively short period of time compared to their development colleagues. In Maban for example, there was hardly anyone at management or coordination level who had been there from the start of the emergency a year previous.. Unfortunately, this does mean that data, when stored in the ways described above, needs to be handed over from laptop to laptop. This of course with each new user defining their own filing system, possibly incorporating the old filing system into a single folder titled ‘Joe’s Stuff’. I can assure you that when you arrive during the fifth rotation and you are trying to centralize and standardize data from multiple sectors, it does not go smoothly.
3. Lack of Data Access/Sharing
Although it does happen that organizations refuse to share information on some principal or another, most organizations realize that they are funded by donations/taxes from the public and therefore have an obligation to be transparent about the data they collect where they are not prohibited by local restrictions to do so. Unfortunately, there are a number of reasons why data is sometimes not shared, but to put it short: it usually requires too much effort with little meaningful reward in the form of useful compilation and feedback.
4. Lack of Analytical Capabilities
Pivot tables and charts are relatively simple, yet powerful tools for analysis, particularly of disaggregated data. Unfortunately, the way most data entry forms are created in excel as well as their chronological compartmentalization by week or month, means that these tools can often not be applied to do meaningful trend and gap analysis at organizational level, nevermind at sector or camp level (see point 3). In addition to this, most mapping of data currently has to be done by specialized teams with experience in GIS.
5. Reporting System
Something I wanted to mention briefly. The current system of donor reporting is based on text heavy formats which are to be submitted at set intervals. Some donors are already leaning more towards real-time reporting, where technical specialists ‘look over the shoulder’ of implementing partners and keep track of quantitative results with corresponding qualitative narrative as they come out, steering partners in the right direction before calamity strikes. This unfortunately is done in addition to conventional reporting, rather than in place of it.
ActivityInfo - Closing the Data Solutions Gap
In order to address some of these issues I set out to create an excel-based database that, although doing to a large extent what it intended, was not exactly practical to use and prone to error. Wondering why, with my self-taught excel ‘skills’, nobody had yet created a piece of software that could address the above issues - but with significantly better means and more user friendly (and a lot slicker looking) - I began to search the internet.
As it turns out, this software does exist and it’s called ActivityInfo and was developed and piloted in the DRC a few years previous. Although I didn’t manage to actually use ActivityInfo in the field, the software contains all the features necessary to address the above problems humanitarians currently face as a result of the tools used and the way we distribute them. Fortunately, the team at BeDataDriven welcomed me on board to help further design ActivityInfo from an NGO field perspective.
ActivityInfo can aid humanitarian and development organizations and clusters in the following way:
1. Resource Intensive
As will become evident further on, ActivityInfo has the ability to make information sharing and reporting significantly less resource intensive by offering both a new set of tools as well as a less intrusive means of distribution and access to data. In other words, the social technologies ActivityInfo offers can make people more productive by increasing value added time.
Besides freeing up time for managers and coordinators in the field who do the bulk of data reformatting and responding to requests for information, ActivityInfo also drives down organizational and sectoral costs. As organizations contribute jointly to the continued development of the software and hosting of their data, the cost of annual contributions on a country and sector level (individual field teams can use the software for free) goes down.
From a donor perspective, better coordination through enhanced sharing of information, as well as, both deeper and quicker analysis means that more potential disasters resulting from poor coordination can be avoided and resources allocated more effectively.
2. Loss of Data
This is primarily reduced through the centralization of data into online databases (accessible offline), as well as the standardization of data into easy-to-use data entry forms, which can still be easily manipulated if indicators or attributes need to be added.
3. Lack of Data Access/Sharing
ActivityInfo significantly reduces barriers to sharing data as well as allowing easy access to selected individuals. Users such as cluster coordinators or County Health Departments can choose to automatically integrate data from multiple databases belonging to different partners or locations. This means that data does not have to be reformatted in order to be shared with various stakeholders. It also means that once an individual is granted access to the data she/he will place less of a burden on field teams when requiring program information without having to resort to more intrusive e-mails or skype calls. In the case that a donor or other stakeholder does not have or want direct access to all of the data being collected, reports can be automatically generated and e-mailed at set time intervals.
4. Lack of Analytical Capabilities
A host of analytical tools similar to excel are available to either gain a quick overview of your data or do in-depth drill downs of disaggregated data. These include pivot tables and graphs, but also allow users, by simply inserting the coordinates of activities once, to create richly detailed maps with polygons and pie charts. Alternatively for those who still prefer to use excel’s tools for analysis, the data can always be exported.
5. Reporting System 2.0
Although the humanitarian and development sectors are still a far cry from the Big Data undertakings by other sectors, this updated set of tools and new way of sharing information has the potential to reform the way reporting is done and progress is measured. Real-Time Reporting has the potential to create a much closer relationship between donor and implementing partner, allowing for better coordination and guidance at the right time, rather than admonishment after the facts. As mentioned previously some of the donors active in Maban were already eager to do this, the only hope is that they will do it instead of and not in spite of conventional reporting.